存档

文章标签 ‘monitor network traffic’

What’ s new in Capsa 7.8

2014年8月28日 没有评论

What’ s new in Capsa 7.8

 VoIP Analysis

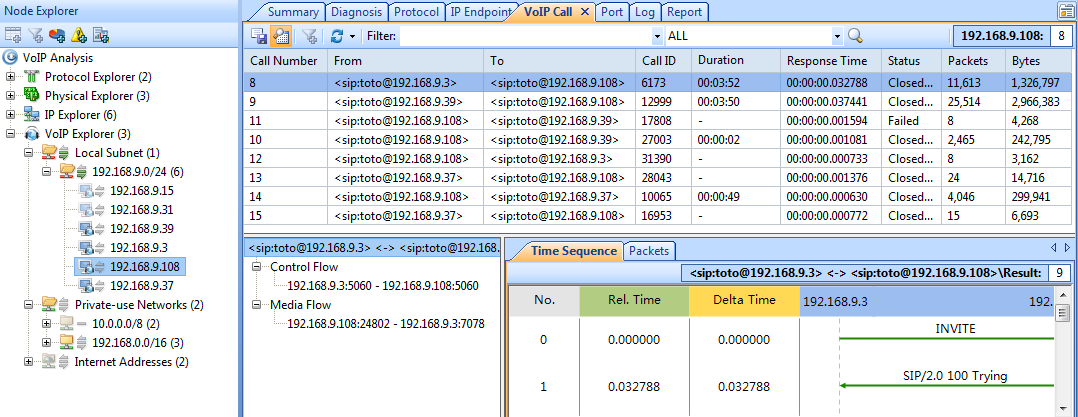
Capsa 7.8 provides a VoIP analysis module to capture and analyze VoIP calls and graphically display VoIP analysis results, which helps IT staff baseline and troubleshoot VoIP-based networks.

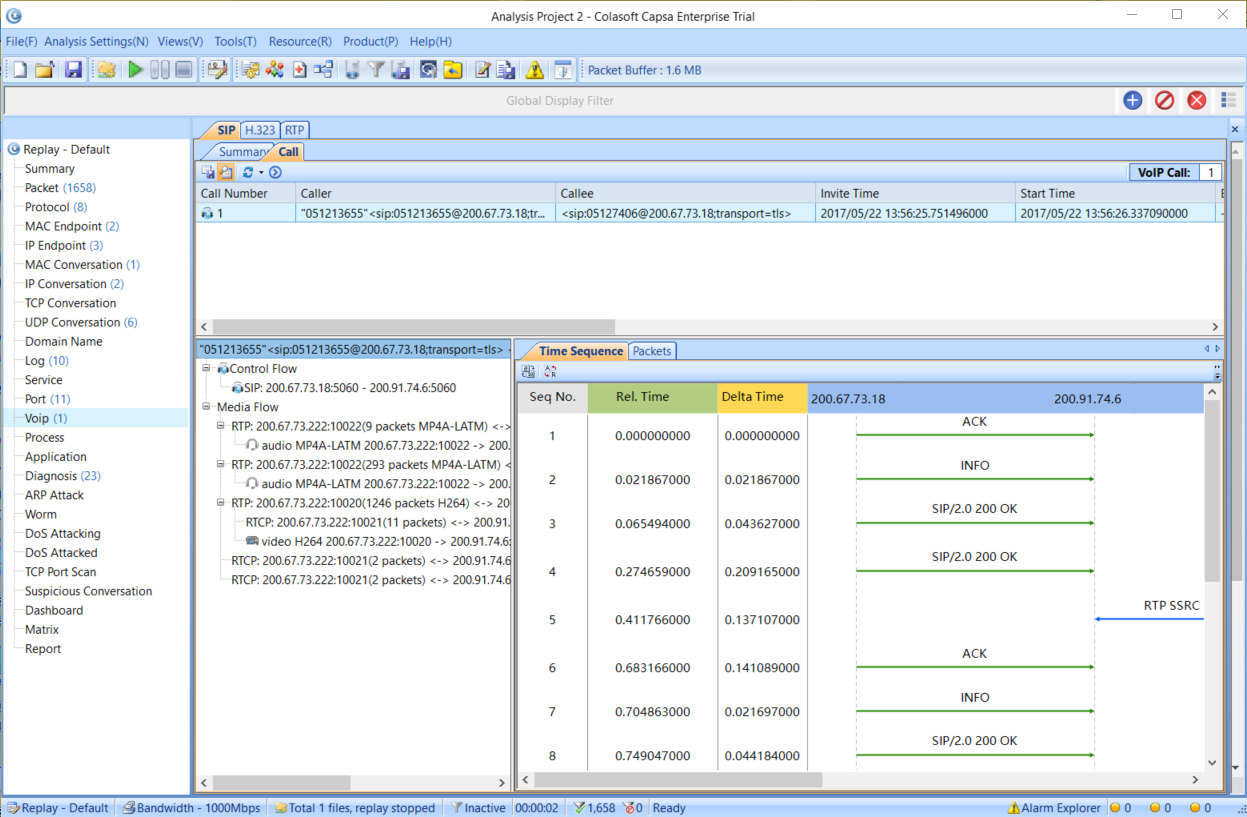
A VoIP view is provided to list all VoIP calls as well as their related statistics and has a lower pane for analyzing voice and video control flows and media flows as well as their jitter, loss, MOS, etc., to visualize analysis data and assess voice and video quality.

Download Capsa

A VoIP Explorer groups private and public IP addresses for VoIP calls.

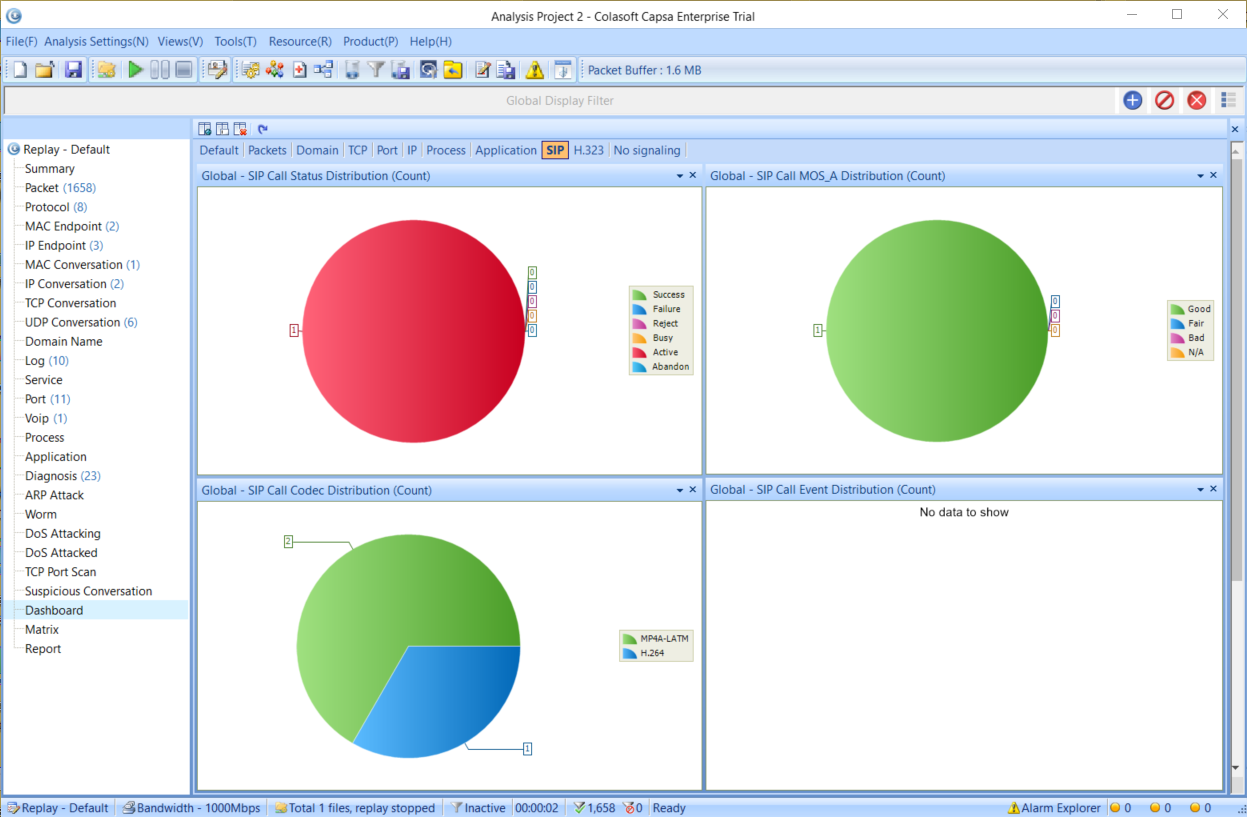
Furthermore, there are VoIP diagnosis events and VoIP logs. A VoIP dashboard contains the VoIP analysis charts graphically.

Together with VoIP Explorer and VoIP diagnosis, the VoIP view helps users visualize analysis data and assess voice and video quality, to thereby assist you troubleshooting VoIP networks, software and hardware.

Top Domain Name Statistics

Earlier versions of Capsa provide a Name Table feature to help network administrators conveniently manage staff’s network activities by displaying the IP address as names instead of figures. Capsa 7.8 here now provides a top domain feature which shows top visited Internet IP addresses as domain names. We know that one domain name may be resolved to be multiple IP addresses, and Capsa can identify all these IP addresses as one domain name if they are actually directed to that domain, and graphically display the top resolved domain names:

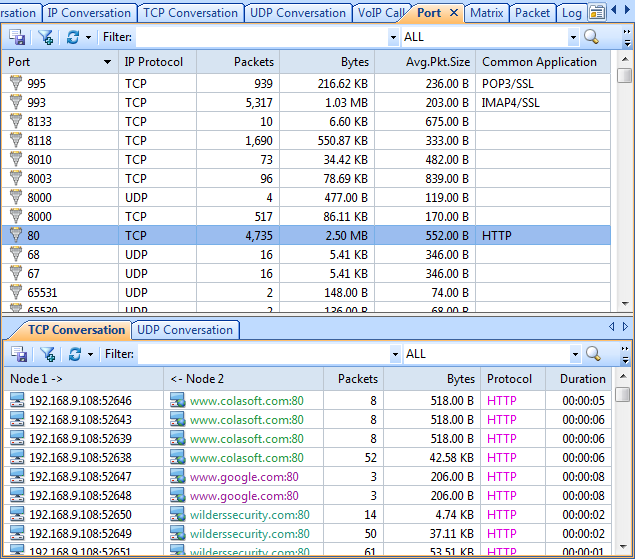
Port – Based Statistics

A Port view is provided to present traffic statistics based on TCP/UDP port numbers. This feature is useful when you want to analyze a specific application. The port numbers are provided with above layer protocol, packets, bytes, average packet size, and common application.

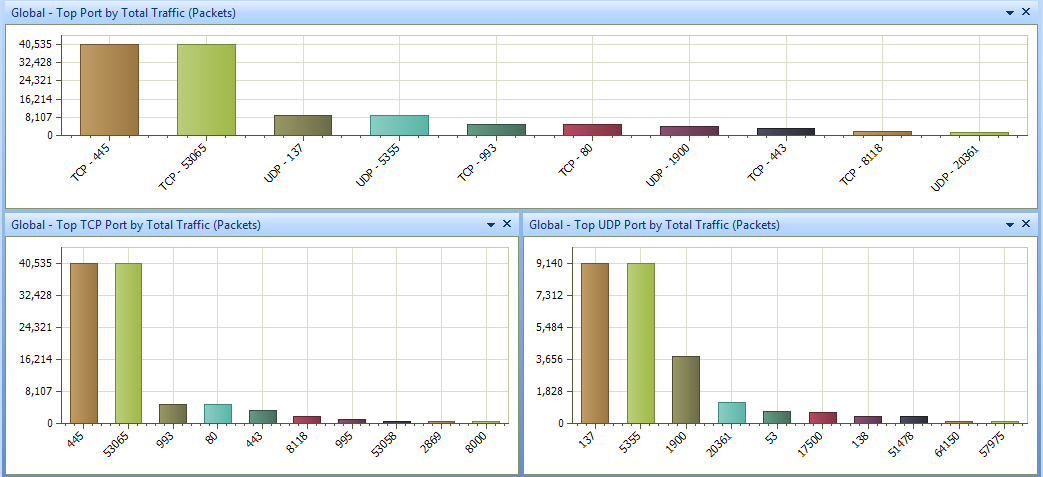
In addition, the Dashboard view provides a Port panel to graphically display top port statistics:
Learn more

How to Monitor Network Packet Loss

2014年6月10日 没有评论

When data is transmitting over computer network, one or more packets may fail to reach their destinations, and this is packet loss.

Packet loss can be caused by multiple factors including network congestion, the performance or policy of networking devices, and networking hardware faults.

Download Capsa

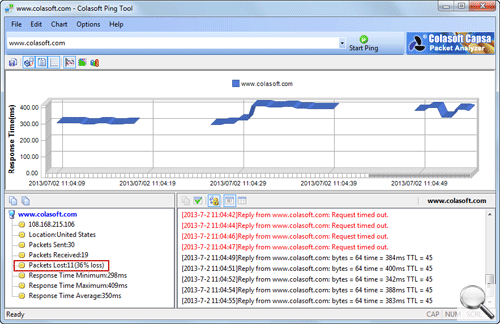
To test the packet loss rate, you can use Colasoft Ping Tool:

To monitor network packet loss to thereby monitor the quality of the network, you can use Colasoft Capsa.

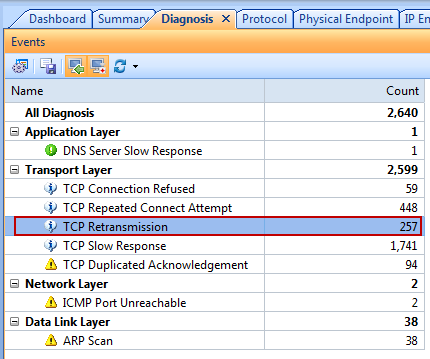
There is a Diagnosis view on Capsa.

  1. If you have a diagnosis event of TCP Retransmission, it means there is maybe packet loss on the network (according to the transmission policy based on TCP/IP protocols, the packet will be retransmitted if it is lost).

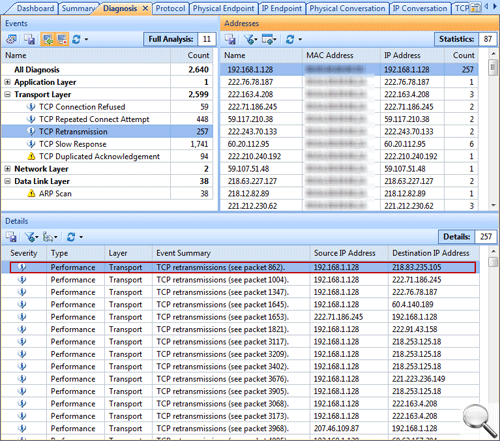
  2. Then, double-click the event on the Details pane:

  3. A window pops up to show the decoding information. According to the Sequence number and the Acknowledge number, it is determined that there is packet loss on the network.

Packet loss is not always a bad thing. It depends on the type of data being sent. For example, when a text document is transmitted, it is unacceptable to drop a single packet. But, for VoIP (Voice over IP) traffic, it is acceptable to drop one or two packets every now and then.

Download Capsa

source: www.colasoft.com

How to Capture Wireless Network Traffic

2014年6月9日 没有评论

As an innovative and high quality network analysis solution, Capsa network analyzer is not only designed to monitor and analyze wired network traffic, but also for wireless LAN traffic, including 802.11 a/b/g/n networks.

The Enterprise Edition of Capsa network analyzer provides you the capability of wireless network capturing and encrypted wireless data decoding. No matter which encryption type an AP uses, all WEP, WPA and even the hardest WPA2 wireless traffic can be decrypted with the pre-specified security key. Additionally you do not have to figure out the encryption type of an AP, Capsa identifies and matches the encryption type of keys automatically.

Download Capsa

We all know that users have to connect to an AP (Access Point) in order to access wireless network; users must have a wireless network adapter in order to access a wireless AP. Therefore, to capture wireless traffic, we use Capsa to monitor a wireless network adapter.

Please follow steps below to monitor and capture the traffic of wireless network.

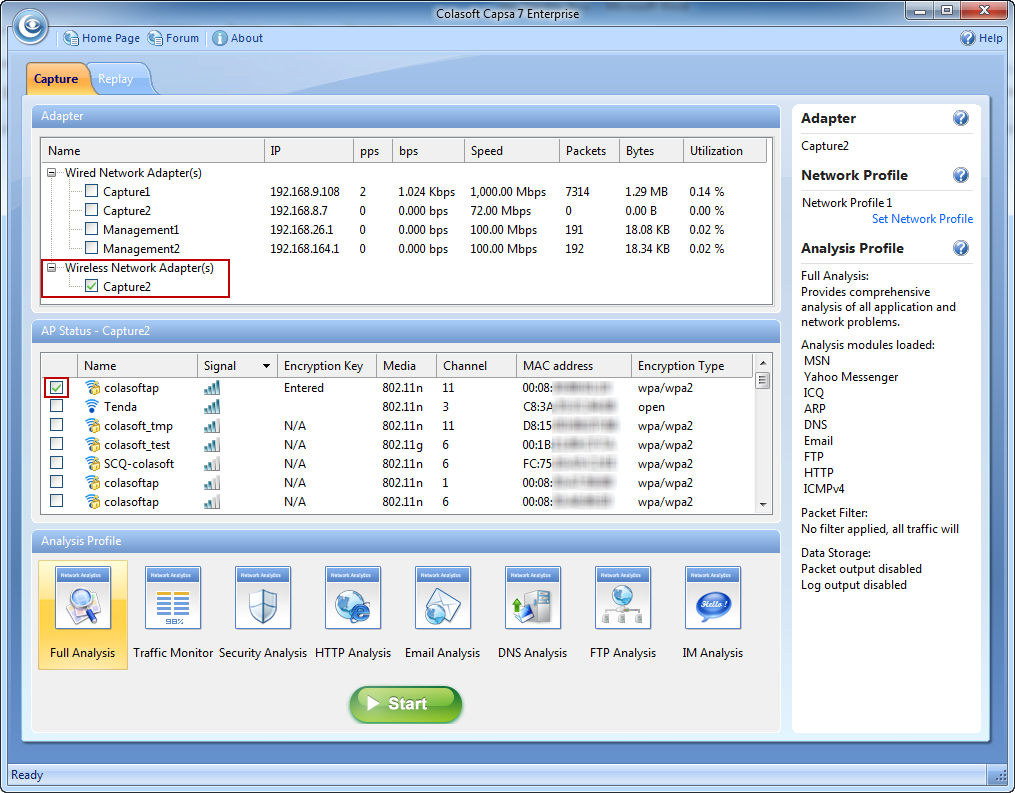
1. On the Start Page, choose a wireless network adapter. Once a wireless network adapter is enabled, Capsa automatically detects and displays all available APs.

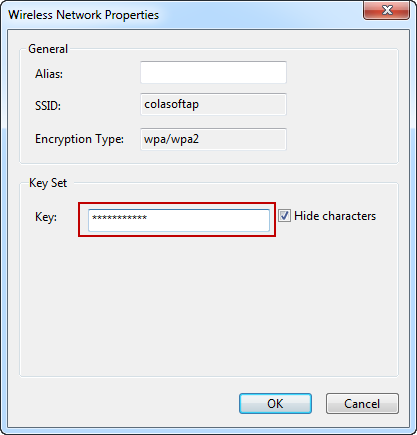
2. Choose an AP that you want to monitor, and if the AP is encrypted, enter the password for it. Once an encrypted AP is enabled, a dialog box pops up to let you enter the key. If the dialog box doesn’t pop up, just double-click the AP to open the box.

3. Click Start to start monitoring; or if you want to set up alarms, capture filters, packet auto-saving, choose a proper network profile and a proper analysis profile and then click Start to start monitoring

  • Once a wireless network adapter is used for capturing packets, it cannot be used for accessing the network anymore.
  • If you enter the wrong key for an AP, the analysis project will run as well but it will not decode any packets.
  • One analysis project can monitor multiple APs at a time, but the APs must be at the same channel.

 To decode and analyze wireless traffic, you are recommended to:

  • Make sure the password for monitored AP is correct.
  • Be close enough to the wireless router (signal source) to thereby capture all packets.
  • Monitor the AP before other hosts access the network to thereby capture EAPOL handshake packets.

Download Capsa

from www.colasoft.com

nChronos How-to: Set up a Traffic Alarm and Get Notification Emails

2014年6月3日 没有评论

nChronos provides a Traffic Alarm, which is defined by users, so as to notify there is traffic abnormal on the network.

To set up a traffic alarm,

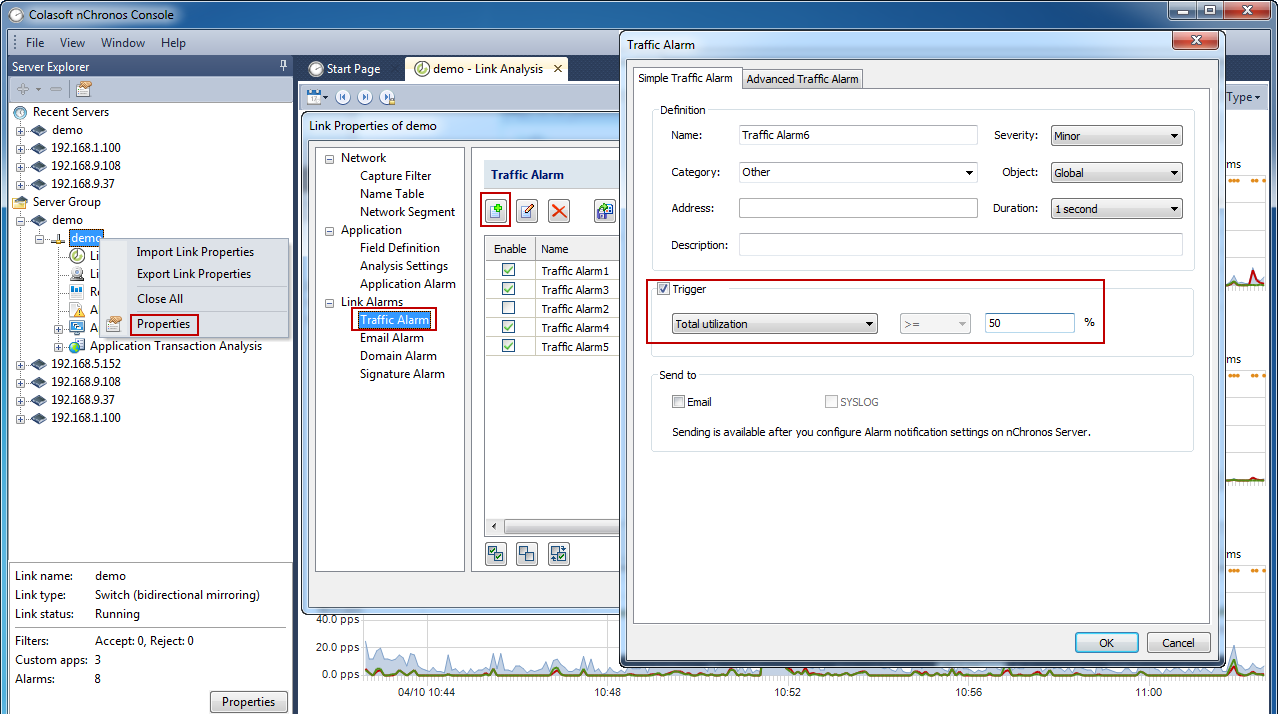
1. Right-click the network link, click Properties to open the Link Properties dialog box. On the Link Properties box, go to the Traffic Alarm tab, and click the New Traffic Alarm button to open the Traffic Alarm box:

Download Capsa

2. On the Simple Traffic Alarm tab of the Traffic Alarm dialog box, complete theDefinition section. The following list describes the options:

  • Name: The name of the new alarm.
  • Severity: The severity of the new alarm. It could be Minor, Major, and Severity.
  • Category: The category of the new alarm.
  • Object: Specifies the object that the alarm is made for.
  • Address: This setting will change to be Application when the Object setting is Any application or Single application. This setting is for specifying an address or an application.
  • Duration: The time that the trigger condition lasts.
  • Description: The description of the alarm.

3. Select the Trigger checkbox to set the trigger condition.

4. Click OK on the Traffic Alarm dialog box, and then click OK on the Traffic Alarm tab to make the traffic alarm take effect.

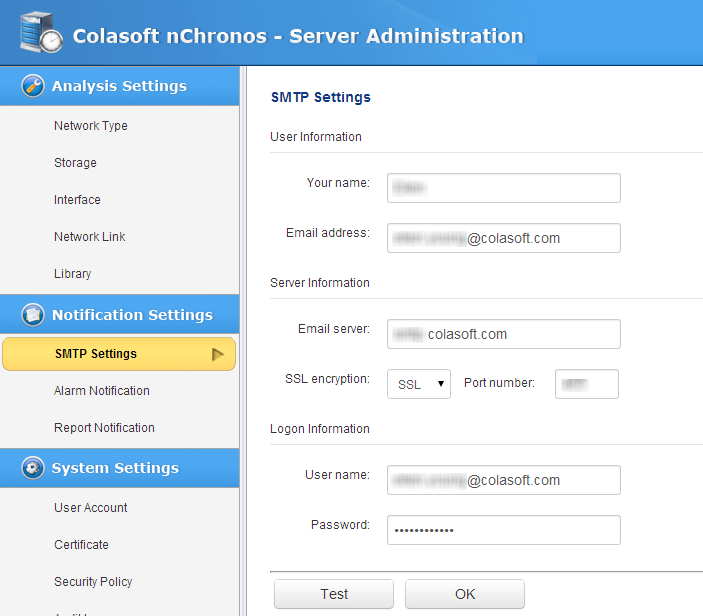
When alarms are triggered, there are alarm logs to record related information. The alarm logs are displayed on the Alarm window. If you want to receive emails containing the alarm logs, you need to enable the checkbox Email  when defining an alarm. If the checkbox is unavailable, you should first configure SMTP settings and Alarm Notification settings from Server web portal:

Download Capsa


source: www.colasoft.com

Colasoft nChronos How-to: Define and Customize a Report

2014年5月30日 没有评论

Colasoft nChronos provides twelve system reports, and users can define new reports according to need.

To define a report,,

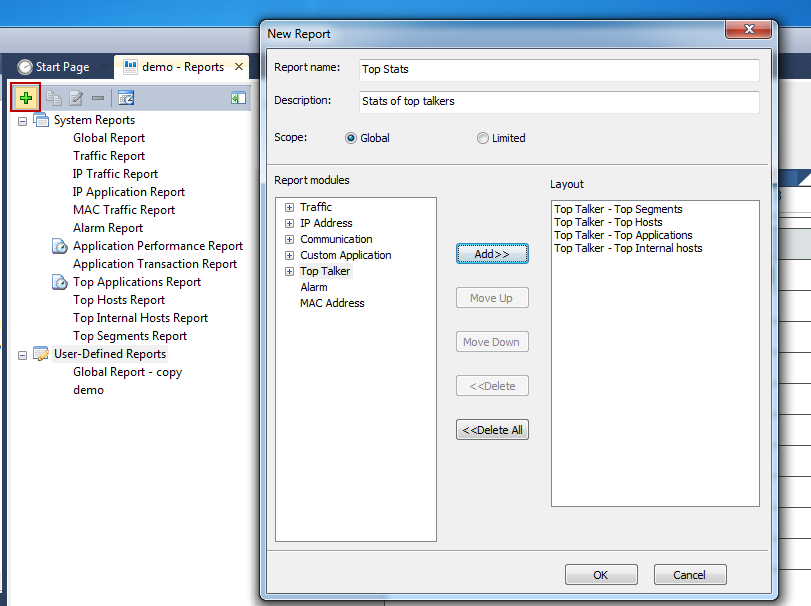
1. On the Report window, first click the node User-Defined Reports, and then click to open the New Report dialog box:

2. Enter the report name and the description.

3. Select the report scope.

  • If you want to create a report for all network objects, click Global, which means the report statistics are calculated based on all network objects.
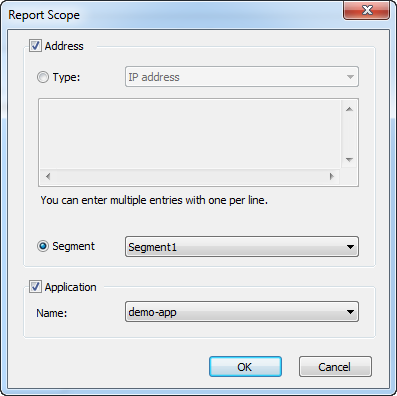
  • If you want to create a report for a specific network object, click Limited to open the Report Scope dialog box:The scope could be IP addresses, MAC addresses, network segment, or a user-defined application, which means the report statistics are calculated based on selected scope.
4. Click the report modules you are interested and then click Add to add the interested report modules to the new report. Different report scope is provided with different report modules. The Global scope is provided with all report modules. For some modules, you can set the number of statistical objects.

5. Click OK to save the definitions. You can view the new report under the node User-Defined Reports.

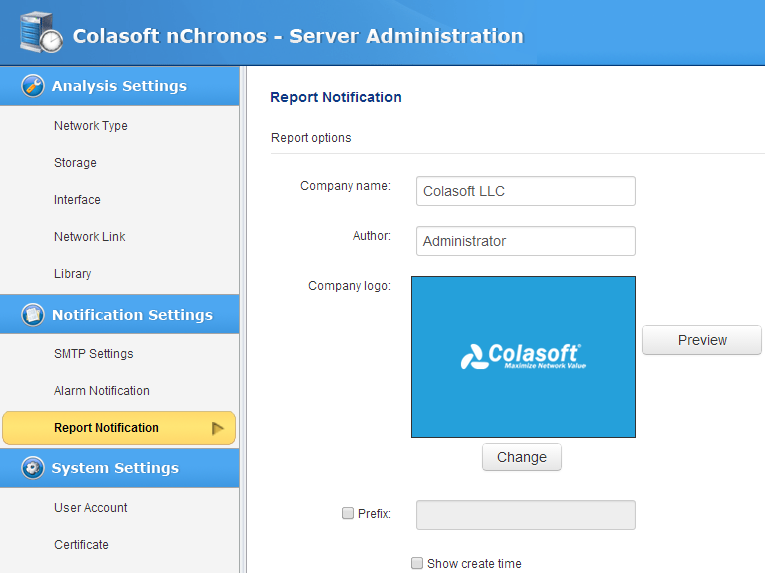
Besides defining new reports, you can customize the company name, company logo, author, report title prefix, whether to show create time, and all these settings can be done on the Report Notification page from Server web portal:

Download Capsa


Read more…

How to View and Analyze Historical Network Traffic

2014年5月21日 没有评论

How to View and Analyze Historical Network Traffic

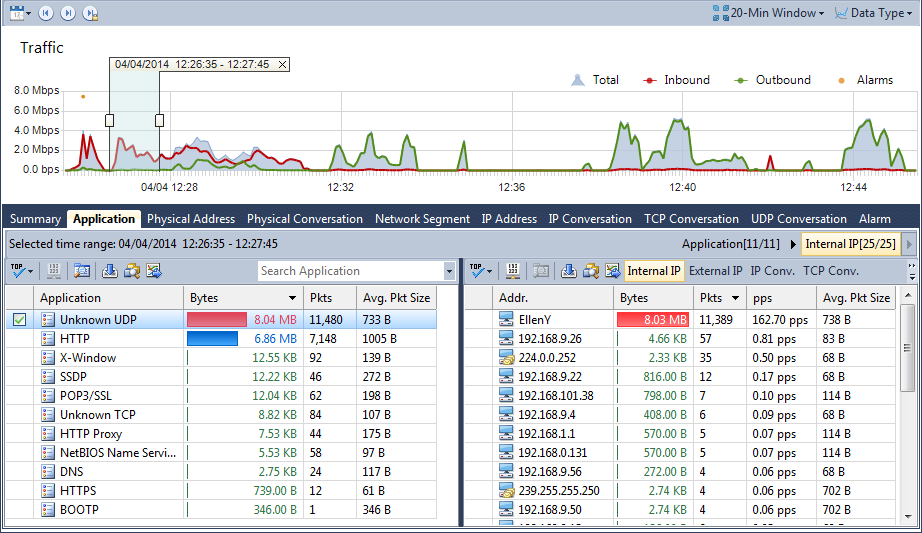
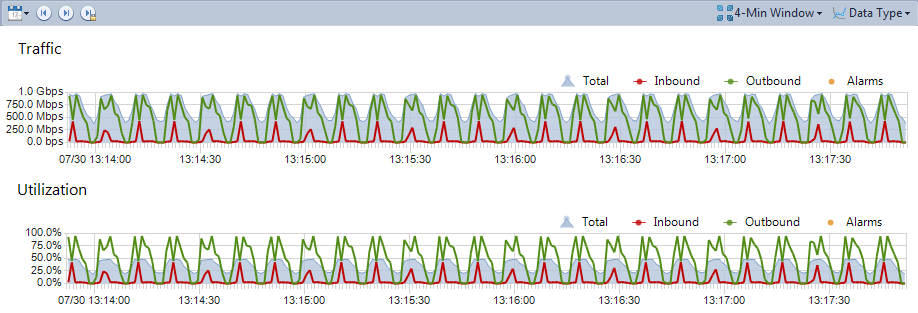
As a network forensic analysis application, nChronos allows users to view historical data just by a drag. Below is a screenshot of the Time Window, you can drag the trend charts back and forth to view the network traffic of any interested time period.

Download Capsa

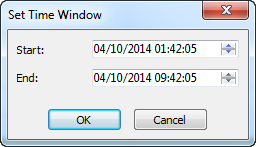
You can click the Set Time Window button  to set which time period to show:

When you select a time slice on the Time Window, the analysis views will only show data related to that time slice, and this is very convenient to analyze a traffic spike. Just select the spike to view and analyze the top talkers in that spike. Furthermore, you can double-click a record item to drill down it:

Download Capsa

from: colasoft.com

Review:Taking Colasoft’s Capsa 7 Enterprise For a Spin

2013年12月31日 没有评论

Lee H.Badman, Wirednot, Dec. 28th, 2013

A few weeks back, I was invited by Colasoft to take a look at their Capsa 7 Enterpriseanalyzer. Having a little time off around the holidays, I finally got around to spending a couple of hours with the product. This hardly constitutes an in-depth review, but I can share some of the first impressions this interesting and powerful tool made on me during playtime.

I was vaguely familiar with Colasoft, having looked at some of their rather nifty freebies (like a multi-host ping tool) in the past. Wanting to get oriented before digging in, I popped in on the website to see what the promise of Capsa 7 Enterprise amounts to. Lifted from Colasoft’spages:

Key Features of Capsa Enterprise:

  • Real-time packet capture as well as the ability to save data transmitted over local networks, including wired network and wireless network like802.11a/b/g/n;
  • Identify and analyze more than 500 network protocols, as well as network applications based on the protocol analysis;
  • Identify “Top Talkers” by monitoring network bandwidth and usage by capturing data packets transmitted over the network and providing summary and decoding information about these packets;
  • Overview Dashboard allows you to view network statistics at a single glance, allowing for easy interpretation of network utilization data;
  • Monitor and save Internet e-mail and instant messaging traffic, helping identify security and confidential data handling violations;
  • Diagnose and pinpoint network problems in seconds by detecting and locating suspicious hosts;
  • Ability to Map the traffic, IP address, and MAC of each host on the network, allowing for easy identification of each host and the traffic that passes through each;
  • Visualize the entire network in an ellipse that shows the connections and traffic between each host.

It’s a pretty ambitious feature set, for a $995 price tag. (“Enterprise” differs from “Professional” in that Professional doesn’t do WLAN.) Capsa is only available for Windows (all versions), and this is a laptop analysis tool rather than a datacenter-racked super-sleuther. Also- WLAN support includes up to 802.11n, but not .11ac yet.

That’s the intro, but how does the product actually perform? I’ll admit to being impressed.

Image

Though I know my way around plenty of CLIs, I’m a UI guy- I hate sucky, confusing, ill-laid out interfaces. Colasoft passes my muster in this regard- Capsa 7 packs a surprising amount of analysis info into a peppy and nicely designed dashboard. Having little Ethernet in my home these days and not wanting to get up off my duff to set up a wired test scenario (it’s the holiday break, after all) I aimed most of my tire-kicking at my home WLAN environment (currently a mix of Aerohive and Meraki). As with any analysis tool, you start by selecting your adapter, and in this case a WLAN channel and one or more SSIDs, and off you go- no AirPcap needed or any sort of special drivers (I tested it with a number of adapters, all did well).

You get variety of analysis profiles to pick from (Full, Traffic Monitoring, Security, HTTP, Email, DNS, FTP, Instant Messaging), and deep views into the gory details of 802.11/802.3 packets as you would with any competing tool. You also get just a nice range of different views that feel AirMagnet-y (or WildPackets-y) at times, but what you don’t get is any of the spectrum type channel plots that MetaGeek gives. Short of that, Capsa 7 is pretty comprehensive.

My “testing” amounted to generating a bunch of nothing-special network traffic both locally and across the Internet, and then drilling into it looking for anyplace I might want to go for analysis that Capsa fell short on. There just wasn’t any.

I am intrigued enough to play further, and my fully-functional eval copy will also get turned loose on my big WLAN when I get back to work to see how it does in the presence of an enterprise-grade 802.1x Wi-FI environment with a ridiculous order of magnitude more clients than I have at home. If there is anything good or bad to add, I’ll come back and amend this post.

Meanwhile, Colasoft does make Capsa 7 available for free 15-day trials.

If you’re in the market for a decent all-in-one wired/wireless analyzer, AND you don’t need 11ac support, AND you run Windows, you might want to have a look at Capsa 7 Enterprise.


How to baseline network throughput and performance

2012年5月10日 1 条评论

What is network baseline?

Do you know what your normal network throughput volume is, what types of traffic are most used in your network? If you can’t answer these questions then you should baseline your network. Network baseline is very important to network management because the data will tell you what it’s like when everything goes all right.

To baseline your network, you need software or hardware to listen on your network or a particular device. Both Colasoft nChronos and Capsa can be used to accomplish this task. Both of them are used to listen into packet data of a wire and generate all kinds of statistics on the network. To baseline a network, you need to use them to monitor the network traffic long enough, because a wider time span presents a more real picture of network traffic pattern. The use of network baseline is listed as follows:

• Understand healthy network pattern and traffic trends.

• Evaluate network management policies compliance.

• Understand how the network resources are allocated.

• Accelerate to troubleshoot network issues, i.e. abnormal traffic and spam traffic, etc.

• Provide data on network and security management to support decision making.

• Provide history statistics on network upgrade.
阅读全文…

Colasoft nChronos: How to Display IP Addresses as Host Names

2012年3月27日 1 条评论

If you use nChronos to monitor traffic on a core switch you will see lots of internal IP addresses, and also the Internet IP addresses. You can find that most of the Internet IP addresses are shown as their domain name, such as www.colasoft.com, and www.google.com, etc. Wouldn’t it be great if nChronos shows host names of our local machines, because they are much easier to understand, rather than just IP addresses? This tips article will show you how to use Name Table to display IP and MAC addresses as host names.

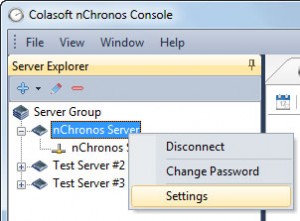
Suppose that there is a user, Steve, whose laptop has this IP address, 192.168.8.25, and you want nChronos to show his IP address as the text – Steve’s Laptop. First you run nChronos Console, connect to the server, right-click on the server name, and click Settings from the context menu. Then select Name Table on the Server Settings window.

阅读全文…

How to monitor network traffic in windows 7 with Capsa network analyzer?

2010年7月13日 1 条评论

Network traffic is data in a network. In computer networks, the data is encapsulated in packets. So network traffic monitoring is to capture all the packets going down the network. Sometimes, it will be very useful to check your network activity. When Windows 7 network is very slow, internet browsing is very slow, connection problems and high network activity occurs when you do nothing, you will find this really helpful. The purpose of this article is to help you understand how to monitor network traffic in windows 7 with Capsa network analyzer.

About Capsa Network Analyzer

Capsa is an easy-to-use Ethernet packet sniffer (network analyzer or network sniffer) for network traffic monitoring and troubleshooting purposes. It performs real-time packet capturing, 24/7 network monitoring, reliable network forensics, advanced protocol analyzing, in-depth packet decoding, and automatic expert diagnosing. By giving you insights into all of your network’s operations, Capsa makes it easy to isolate and solve network problems, identify network bottleneck and bandwidth use, and detect network vulnerabilities.

Solution 1. Monitor network traffic in the Dashboard tab of Capsa network analyzer

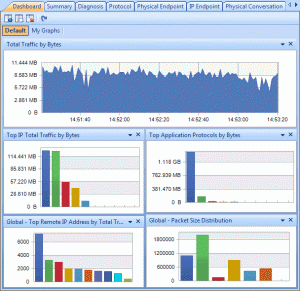
If we want to have a graphical view of the statistics or get a trend chart of the network traffic, then we can use the graphs in the Dashboard tab. It provides a great many of statistic graphs from global network to a specific node. You are able to as well create almost any kind of graph based on any MAC address, IP address and protocol, etc. With these graphs, you can easily find out anomalies of the network and get useful statistics.
dashboard-tab

Solution 2. Monitor network traffic in the Summary tab of Capsa network analyzer

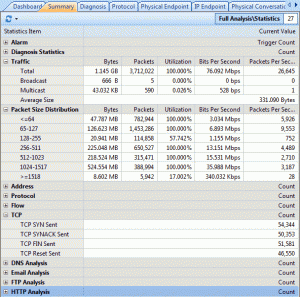
The Summary tab provides general information of the entire network or the selected node in the Node Explorer window. In the Summary tab we can get a quick view of the total traffic, real-time traffic, broadcast traffic, multicast traffic and so on. When we switch among the node in the Node Explorer window, corresponding traffic information will be provided.
summary-tab

Solution 3. Monitor network traffic in the Physical Endpoint and IP Endpoint tabs of Capsa network analyzer

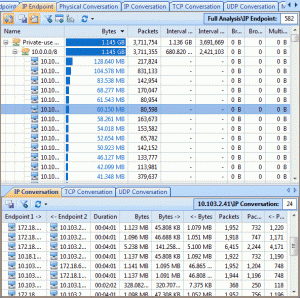
In these two endpoint tabs (Physical Endpoint and IP Endpoint), we can monitor network traffic information of each physical address node and IP address node, both local and remote. With their easy sorting feature we can easily find out the nodes with abnormal traffic, such as which hosts are generating or have generated the largest traffic.
ip-endpoint-tab

Solution 4. Monitor network traffic in the Protocol tab of Capsa network analyzer

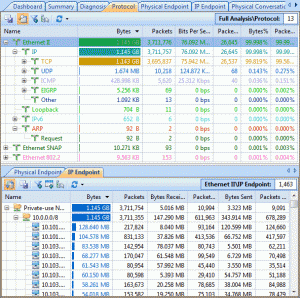
The Protocol tab lists all protocols applied in your network transmission. In the Protocol tab we can monitor network traffic by each protocol. By analyzing the protocols in the network traffic, we can easily understand what applications are consuming the network bandwidth, for example, the HTTP stands for website browsing, and the POP3 stands for email, etc.
protocol-tab

Solution 5. Monitor network traffic in the Matrix tab of Capsa network analyzer

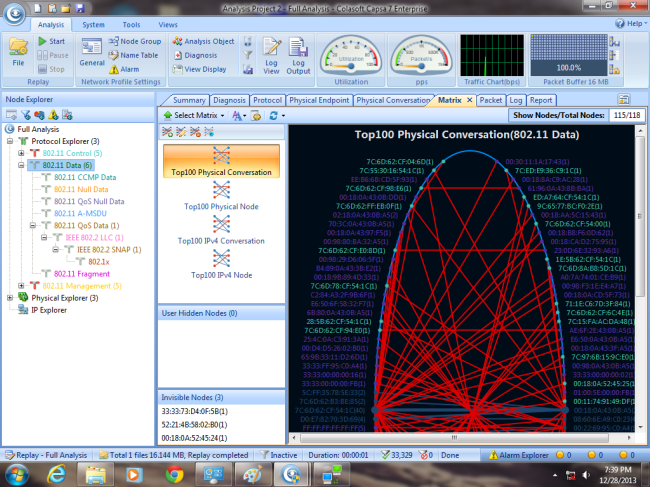
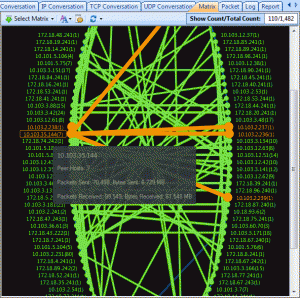
The Matrix tab visualizes all network connections and traffic details in one single graph. The weight of the lines between the nodes indicates the traffic volume and the color indicates the status. As we move the cursor on a specific node, network traffic details of the node will be provided.
matrix-tab

These are the very basic methods of monitoring network traffic in windows 7 with Capsa network analyzer, there are lot of advanced functions available on Capsa Network Analyzer 7 .

Share your experience with this tool and any new findings on this is welcomed.