存档

文章标签 ‘howto’

Improve Network Efficiency With Colasoft Capsa Conversation Colorization Feature

2015年10月10日 没有评论

Troubleshooting network problems can be a very difficult and challenging task. While most IT engineers use a network analyzer to help solve network problems, whenanalyzing hundreds or thousands of packets, it can become very hard to locate and further research conversations between hosts. Colasoft’s Capsa v8 now introduces a new feature that allows us to highlight-colorize relevant IP conversations in the network based on their MAC address, IP Addresses, TCP or UDP conversations.

Download your copy of Colasoft Capsa v8 and discover how easy it is to identify network related problems.

This great new feature will allow IT engineers to quickly find the related packets of the conversations they want to analyze emphatically, using just a few clicks.

As shown in the screenshot below, users can colorize any Conversation in the MAC Conversation View, IP Conversation View, TCP Conversation View and UDP Conversation View. Packets related to that Conversation will be colorized automatically with the same color.

Take TCP conversation for example, choose one conversation, right-click it and choose “Select Conversation Color” in the pop-up menu:

Figure 1. Selecting a Conversation Color in Capsa v8.0

Next, select the color you wish to use to highlight the specific conversation:

Figure 2. Selecting a color

Once the color has been selected, Capsa will automatically find and highlight all related packets of this conversation using the same background color:

Figure 3. Colasoft Capsa automatically identifies and highlights the conversation

The relevance between a conversation and its packets is enhanced by colorizing packets which greatly improves analysis efficiency.

If you’re a network administrator, engineer or IT manager, we strongly suggest you try out Capsa and see how easy you can discoverand resolve network problems.

From: http://www.firewall.cx/general-topics-reviews/colasoft/capsa-network-analyzer/1106-colasoft-capsa-colorization-feature-improve-network-analysis.html


Migrating Configuration Files from nChronos Evaluation to an nChronos Licensed Version

2014年11月7日 没有评论

Migrating configuration files on the same machine

The following steps will allow you to migrate configuration files from an nChronos Evaluation to an nChronos Licensed version on the same machine.

  1. When uninstalling nChronos Evaluation program please click “Yes” when following box pops up:
  2. Install the nChronos Licensed version. By clicking this uninstall “Save” action all configurations and captured data files will be saved automatically.

Migrating configuration files to a different machine

Follow the following steps if you installed the nChronos Evaluation version on one machine and now want to migrate the files to an nChronos Licensed version on a different machine,

  1. Export the configurations from nChronos Evaluation. Login to the nChronos Server web portal then go to the Server Management page and click Export Config button to save the configurations:
  2. Install and activate the new licensed version of nChronos. Login to the nChronos Server web portal, go to the Server Management page, and click the Import Config button to import the saved file in step 1.
  3. After the import is complete the nChronos service will automatically restart. After the restart, the configuration files will now be migrated.

Download Capsa

How to Monitor Network Packet Loss

2014年6月10日 没有评论

When data is transmitting over computer network, one or more packets may fail to reach their destinations, and this is packet loss.

Packet loss can be caused by multiple factors including network congestion, the performance or policy of networking devices, and networking hardware faults.

Download Capsa

To test the packet loss rate, you can use Colasoft Ping Tool:

To monitor network packet loss to thereby monitor the quality of the network, you can use Colasoft Capsa.

There is a Diagnosis view on Capsa.

  1. If you have a diagnosis event of TCP Retransmission, it means there is maybe packet loss on the network (according to the transmission policy based on TCP/IP protocols, the packet will be retransmitted if it is lost).

  2. Then, double-click the event on the Details pane:

  3. A window pops up to show the decoding information. According to the Sequence number and the Acknowledge number, it is determined that there is packet loss on the network.

Packet loss is not always a bad thing. It depends on the type of data being sent. For example, when a text document is transmitted, it is unacceptable to drop a single packet. But, for VoIP (Voice over IP) traffic, it is acceptable to drop one or two packets every now and then.

Download Capsa

source: www.colasoft.com

How to Capture Wireless Network Traffic

2014年6月9日 没有评论

As an innovative and high quality network analysis solution, Capsa network analyzer is not only designed to monitor and analyze wired network traffic, but also for wireless LAN traffic, including 802.11 a/b/g/n networks.

The Enterprise Edition of Capsa network analyzer provides you the capability of wireless network capturing and encrypted wireless data decoding. No matter which encryption type an AP uses, all WEP, WPA and even the hardest WPA2 wireless traffic can be decrypted with the pre-specified security key. Additionally you do not have to figure out the encryption type of an AP, Capsa identifies and matches the encryption type of keys automatically.

Download Capsa

We all know that users have to connect to an AP (Access Point) in order to access wireless network; users must have a wireless network adapter in order to access a wireless AP. Therefore, to capture wireless traffic, we use Capsa to monitor a wireless network adapter.

Please follow steps below to monitor and capture the traffic of wireless network.

1. On the Start Page, choose a wireless network adapter. Once a wireless network adapter is enabled, Capsa automatically detects and displays all available APs.

2. Choose an AP that you want to monitor, and if the AP is encrypted, enter the password for it. Once an encrypted AP is enabled, a dialog box pops up to let you enter the key. If the dialog box doesn’t pop up, just double-click the AP to open the box.

3. Click Start to start monitoring; or if you want to set up alarms, capture filters, packet auto-saving, choose a proper network profile and a proper analysis profile and then click Start to start monitoring

  • Once a wireless network adapter is used for capturing packets, it cannot be used for accessing the network anymore.
  • If you enter the wrong key for an AP, the analysis project will run as well but it will not decode any packets.
  • One analysis project can monitor multiple APs at a time, but the APs must be at the same channel.

 To decode and analyze wireless traffic, you are recommended to:

  • Make sure the password for monitored AP is correct.
  • Be close enough to the wireless router (signal source) to thereby capture all packets.
  • Monitor the AP before other hosts access the network to thereby capture EAPOL handshake packets.

Download Capsa

from www.colasoft.com

nChronos How-to: Define and Customize a Report

2014年6月3日 没有评论

Colasoft nChronos provides twelve system reports, and users can define new reports according to need.

To define a report,,

1. On the Report window, first click the node User-Defined Reports, and then click to open the New Report dialog box:

2. Enter the report name and the description.

3. Select the report scope.

  • If you want to create a report for all network objects, click Global, which means the report statistics are calculated based on all network objects.
  • If you want to create a report for a specific network object, click Limited to open the Report Scope dialog box:

    The scope could be IP addresses, MAC addresses, network segment, or a user-defined application, which means the report statistics are calculated based on selected scope.

4. Click the report modules you are interested and then click Add to add the interested report modules to the new report. Different report scope is provided with different report modules. The Global scope is provided with all report modules. For some modules, you can set the number of statistical objects.

5. Click OK to save the definitions. You can view the new report under the node User-Defined Reports.

Besides defining new reports, you can customize the company name, company logo, author, report title prefix, whether to show create time, and all these settings can be done on the Report Notification page from Server web portal:

Download Capsa


From www.colasoft.com

nChronos How-to: Set up a Traffic Alarm and Get Notification Emails

2014年6月3日 没有评论

nChronos provides a Traffic Alarm, which is defined by users, so as to notify there is traffic abnormal on the network.

To set up a traffic alarm,

1. Right-click the network link, click Properties to open the Link Properties dialog box. On the Link Properties box, go to the Traffic Alarm tab, and click the New Traffic Alarm button to open the Traffic Alarm box:

Download Capsa

2. On the Simple Traffic Alarm tab of the Traffic Alarm dialog box, complete theDefinition section. The following list describes the options:

  • Name: The name of the new alarm.
  • Severity: The severity of the new alarm. It could be Minor, Major, and Severity.
  • Category: The category of the new alarm.
  • Object: Specifies the object that the alarm is made for.
  • Address: This setting will change to be Application when the Object setting is Any application or Single application. This setting is for specifying an address or an application.
  • Duration: The time that the trigger condition lasts.
  • Description: The description of the alarm.

3. Select the Trigger checkbox to set the trigger condition.

4. Click OK on the Traffic Alarm dialog box, and then click OK on the Traffic Alarm tab to make the traffic alarm take effect.

When alarms are triggered, there are alarm logs to record related information. The alarm logs are displayed on the Alarm window. If you want to receive emails containing the alarm logs, you need to enable the checkbox Email  when defining an alarm. If the checkbox is unavailable, you should first configure SMTP settings and Alarm Notification settings from Server web portal:

Download Capsa


source: www.colasoft.com

Colasoft nChronos How-to: Define and Customize a Report

2014年5月30日 没有评论

Colasoft nChronos provides twelve system reports, and users can define new reports according to need.

To define a report,,

1. On the Report window, first click the node User-Defined Reports, and then click to open the New Report dialog box:

2. Enter the report name and the description.

3. Select the report scope.

  • If you want to create a report for all network objects, click Global, which means the report statistics are calculated based on all network objects.
  • If you want to create a report for a specific network object, click Limited to open the Report Scope dialog box:The scope could be IP addresses, MAC addresses, network segment, or a user-defined application, which means the report statistics are calculated based on selected scope.

4. Click the report modules you are interested and then click Add to add the interested report modules to the new report. Different report scope is provided with different report modules. The Global scope is provided with all report modules. For some modules, you can set the number of statistical objects.

5. Click OK to save the definitions. You can view the new report under the node User-Defined Reports.

Besides defining new reports, you can customize the company name, company logo, author, report title prefix, whether to show create time, and all these settings can be done on the Report Notification page from Server web portal:

Download Capsa


Read more…

Colasoft nChronos How-to: How to Display IP Addresses as Host Names

2014年5月28日 没有评论

How to Display IP Addresses as Host Names

If you use nChronos to monitor traffic on a core switch you will see lots of internal IP addresses, and also the Internet IP addresses. You can find that most of the Internet IP addresses are shown as their domain name, such as www.colasoft.com, and www.google.com, etc. Wouldn’t it be great if nChronos shows host names of our local machines, because they are much easier to understand, rather than just IP addresses? This tips article will show you how to use Name Table to display IP and MAC addresses as host names.

Download Capsa

Suppose that there is a user, Steve, whose laptop has this IP address, 192.168.8.25, and you want nChronos to show his IP address as the text – Steve’s Laptop. First you run nChronos Console, connect to the server, right-click on the server name, and clickSettings from the context menu. Then select Name Table on the Server Settingswindow.

Then click the Add… button on the right side, you see a new dialog box. On this dialog box, input the IP address, 192.168.8.25, and input Steve’s Laptop in the Alias textbox. You can even choose the font color for this name if you like. Then click OK.

There is a little trick that you can input the IP address and click Resolve Address to find the host name automatically. It uses NetBIOS protocol and it’s able to retrieve the host name from that system. Or you can click Resolve Name button to translate the host name into IP address.

Download Capsa

The names you add will be saved on nChronos server, so you see them from every nChronos console. And besides IP addresses, you can still give names to MAC addresses, only that you cannot use name resolution function for MAC addresses.

You’ll find that you cannot click the Edit and Delete buttons sometimes. That’s because you have link window open, and the window uses the names for display. So it doesn’t allow any changes to the names if a link window is open. So you just close all link windows of that nChronos server, and you’ll find the buttons are clickable now.

Colasoft nChronos How-to: How to Connect to nChronos Server

2014年5月26日 没有评论

How to Connect to nChronos Server

Based on the architecture that nChronos stores all data on nChronos Server while nChronos Console works like a display, users who want to view network data have to connect to nChronos Server first.

To connect to nChronos Server, you should first add nChronos Server to nChronos Console.

To add nChronos Server,

1.On the Server Explorer, clickto open the Add Server dialog box:

2. Complete the dialog box. See the following list of each label for more information.

  • Host: The IP address of the management interface on nChronos Server.
  • Port: The port number for connecting to Server. It is 3000 by default.
  • Name: A readable name for identifying the Server, for example, Marketing Dept. It will be the same as the IP address if you don’t enter one.
  • Username: The account for logging the Server.
  • Password: The password for the account.
  • SSL encryption: Applies SSL encryption when transmitting data from the Server to the Console.
  • Data compression: Compresses the data in the transmission from the Server to the Console.

Click OK to save the settings. Then the added server will display under the Server Group on the Server Explorer.

After adding nChronos Server, on the Server Explorer double-click it to make the connection, and then you will see the network link. Double-click Link Monitor and you will view real-time network traffic status.

Download Capsa

Source: colasoft.com

How to Baseline Network Throughput and Performance

2014年5月22日 没有评论

How to Baseline Network Throughput and Performance

What is network baseline?

Do you know what your normal network throughput volume is, what types of traffic are most used in your network? If you can’t answer these questions then you should baseline your network. Network baseline is very important to network management because the data will tell you what it’s like when everything goes all right.

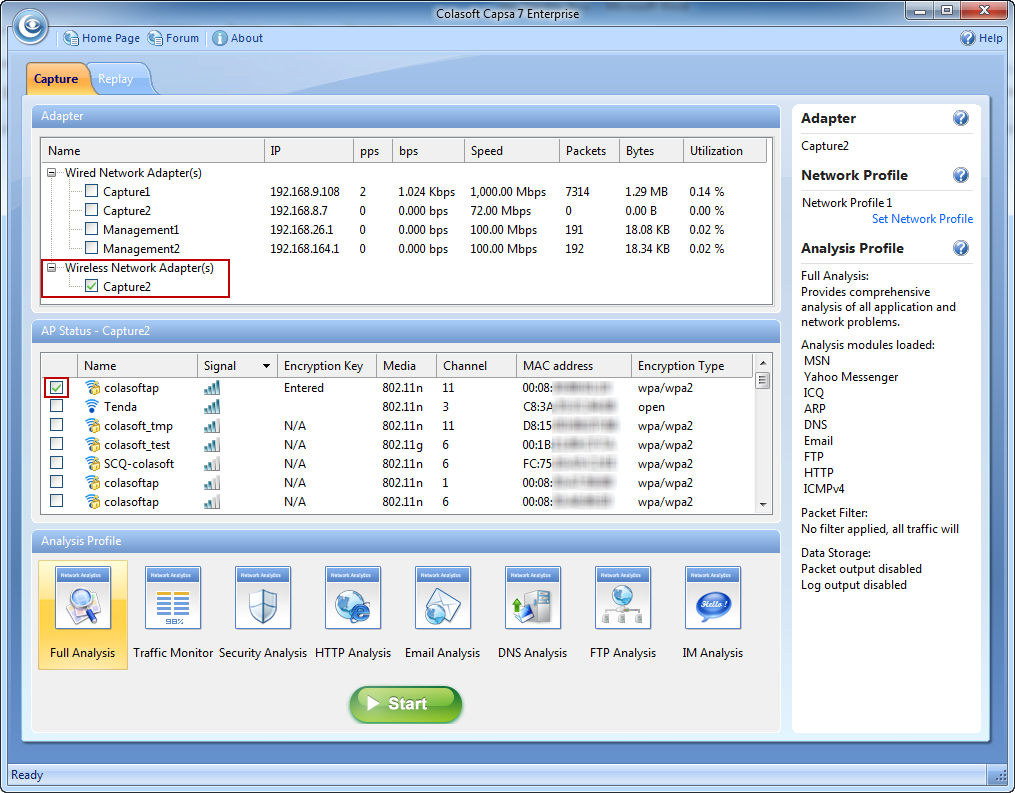
To baseline your network, you need software or hardware to listen on your network or a particular device. Both Colasoft nChronos and Capsa can be used to accomplish this task. Both of them are used to listen into packet data of a wire and generate all kinds of statistics on the network. To baseline a network, you need to use them to monitor the network traffic long enough, because a wider time span presents a more real picture of network traffic pattern. The use of network baseline is listed as follows:

  • Understand healthy network pattern and traffic trends.
  • Evaluate network management policies compliance.
  • Understand how the network resources are allocated.
  • Accelerate to troubleshoot network issues, i.e. abnormal traffic and spam traffic, etc.
  • Provide data on network and security management to support decision making.
  • Provide history statistics on network upgrade.

Download Capsa

How to baseline a network

Preparation

If you want to baseline a network, you can start from the tasks listed below:

1. Network diagram: draw the layout of the network structure, marking IP/MAC addresses, VLAN, and places of all routers, switches, firewalls, servers, management devices, and even the data flow directions.

2. Network management policy: helps you understand what services are allowed to run on the network, what traffic is forbidden, and what services should enjoy higher priority.

Scope & Objectives

When you are ready to start baselining your network, first you should think what to baseline because it’s hard or sometimes unnecessary to include all hosts, switches and routers of a big network into you baseline report. The suggestion is that you divide the network into several layers and only baseline the critical layers. For example, only baseline the services like ERP, Email, HTTP traffic and devices like core switches, routers and critical servers.

In addition to last point, different devices, hosts and links require different types of baseline data. For example, performance and security baseline is important to the servers, and network itself cares about throughput, utilization and types of traffic.

Collect baseline data

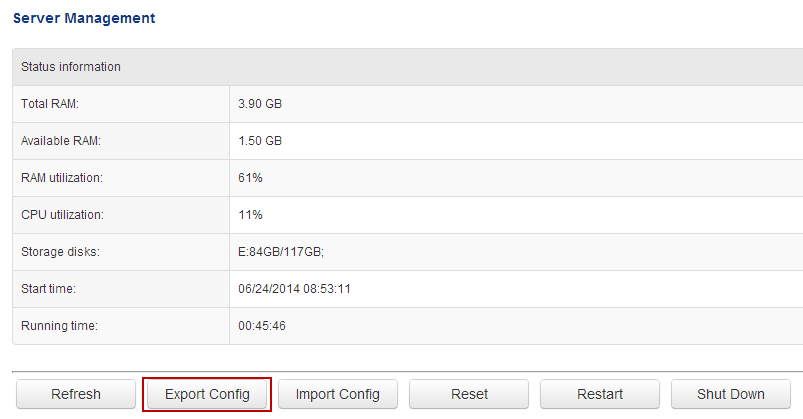
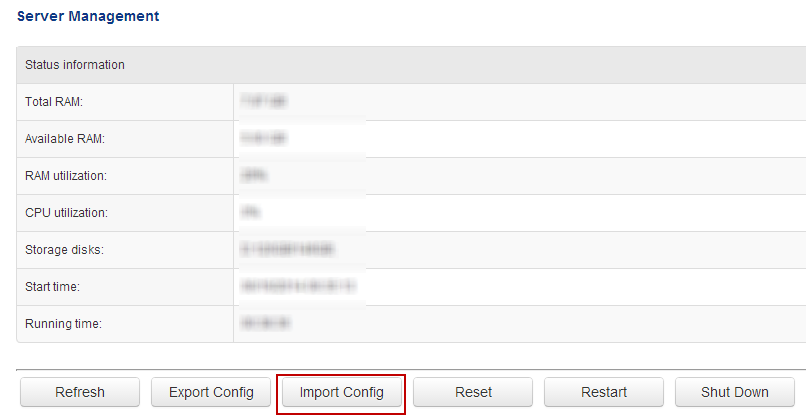
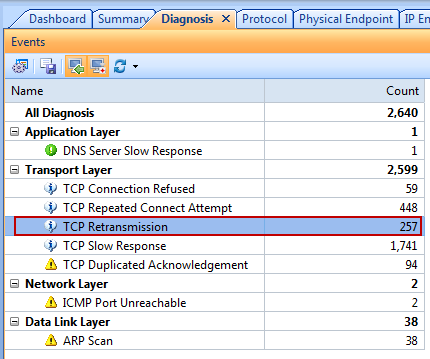
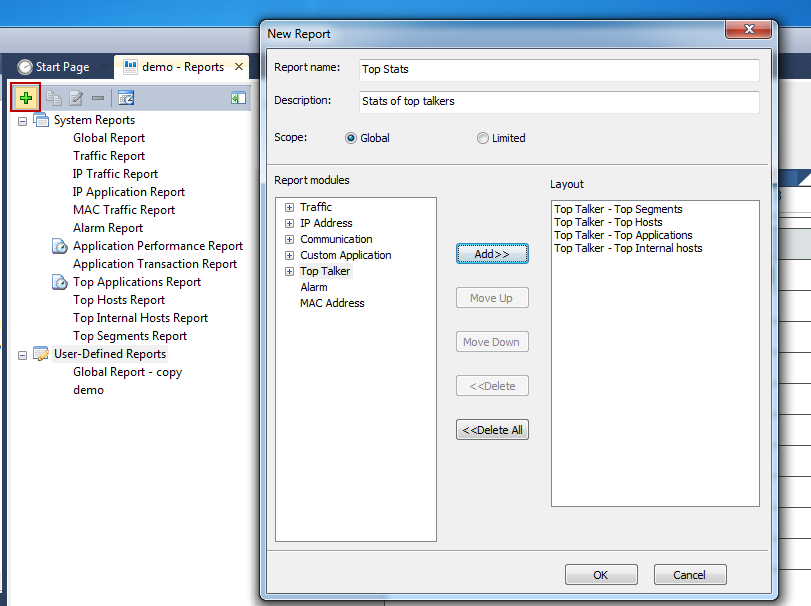
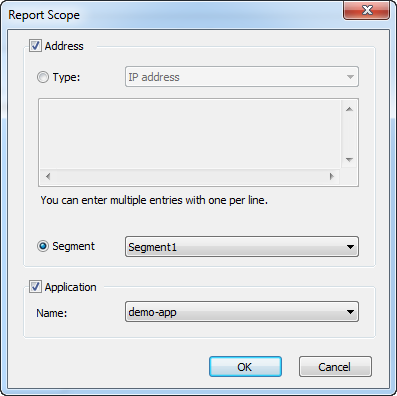
Generally speaking, a network baseline report contains these basic data: network utilization, traffic components, top protocols talkers, top hosts talkers, conversation statistics, address statistics, packet sizes, average packet length, and key server info, etc. Both nChronos and Capsa Network Analyzer provide these types of data (figure below).

To use nChronos or Capsa to baseline a network, you need run nChronos or Capsa and use an excel sheet to record statistics over each specific time period. The following figure shows a typical Excel network benchmark table.

Then you can use formula to work out the max, min, and average value of each data type. And if you keep recording long enough, you get a much precise baseline statistics.

The use of network baseline data

The baseline data is often used when the network is reported to be running improperly. For example, when the network performance drops, you can compare the real-time datacollected from the analyzer with the baseline data to help you spot where the anomalies are.

Download Capsa

Tips for network baselining

Update the baseline document in time

The baseline report is useful only when it provides accurate and up-to-date data. It requires that you update the data in time when there are any changes to the network. For example, when a new device is added, or a new application is implemented, the changes need to be marked on in the baseline report.

An IP/MAC database is necessary

If the network is full of desktops, laptops and switches, you should consider an IP/MAC database to record the user name and place of each individual IP and MAC address. It’s very helpful when you need figure out who is using the IP or MAC and where it is when you decide to give it an examination.

Baseline the critical devices only

Remember, you don’t have to maintain a baseline table which covers all your host computers, laptops, servers, switches, firewalls and routers. If you insist to do so, you’d better prepare enough time for it. You are suggested to only cover the mission-critical servers, such as email, web site, OA and CRM servers, and core switches and routers in your baseline report. And they’d better be organized in separate sheets to help you easily find what data you need.

Baseline over a long time period

It takes a long time to set up a network baseline because your network probably works in different patterns through Monday to Sunday. For example, on Monday morning, your email traffic could be higher than other days because there are lots of emails waiting to be processed after the weekend. On Friday afternoon after 4:00 PM, web traffic could be higher because some are browsing the web to find a place for the weekend. Therefore, your baseline report should cover the time period of a week at least, and you are suggested to extend to 2 ~ 4 weeks.

Keep baseline report easy to read

You should include all useful diagrams and illustrations in baseline report, the more the better, such as a network diagram, network policy, backups for switches and routers. The documents should be standardized with explanations and descriptions, especially for the technical terms. All of them are helpful when someone else is trying to access and read the documents.

Download Capsa

from: colasoft.com