存档

‘Reviews’ 分类的存档

Free Mac Scanner Software: Colasoft Mac Scanner Reviewed By ilovefreesoftware

2016年5月17日 没有评论

Below is the Colasoft Mac Scanner review from ilovefreesoftware.com

Colasoft MAC Scanner is a free network scanner software for Windows. It can scan all the ports of your local network for connected devices. It can provides you the details such as: IP Address, MAC Address, Host Name, Workgroup, and Manufacturer.

It provides the details in tabular format, and you can easily export the data to txt or csv format. The program is helpful for Network Administrators to maintain a list of Network assets. You can easily check who is using your network.

How to Scan Network for Connected Devices using Colasoft MAC Scanner:

It is very easy to use this tool to scan the entire network, and find details of all the connected devices.

You can click Start button on the main toolbar or press F5 key from your keyboard to start the scanning process. You can run it from Start Menu Run command also by typing “csmac” and pressing Enter key. It automatically detects all the Local Subnet list or you can click Refresh from the Local Subnet dropdown. It takes just a few seconds to scan the entire network, and keeps showing details of the devices while scanning.

Once the scanning is complete, you can export the list of connected devices. You can export the list in  .TXT, or .CSV  format, and also in its native .CSCNTAB (Colasoft Name Table File).

The size of the program is just 6.79 MB and it can works with almost every Windows version.

If you want to export only some records for later reference; you can do this too by selecting the records you want and click the Export Selected button on the main toolbar or use context menu command to do so.


More commands like Copy, Delete, Find are also there in the Default toolbar and in the Edit menu. Also if the scanning process is taking much time, you can then Pause or Stop the process any time by pressing the desired button.

Another interesting feature of this software is that it also lets you specify number of threads that can be used for scanning. You can choose between 1 to 100 threads. More the number of threads, faster will be the scanning performance.

Limitations of this software:

Despite being good at what it does, this software comes with its limitations and drawbacks as well. First of all, the documentation of this software talks about some features, which are actually not available in the free version. Secondly, I tested this software multiple times, but it never gave me the “Manufacturer” information.

Get Colasoft Mac Scanner.

Free MAC Scanner Software: Colasoft MAC Scanner reviewed by Arun Kumar on April 15, 2016 rated 4.0 of 5

分类: Reviews 标签:

HOW TO DETECT ARP ATTACKS & ARP FLOODING WITH COLASOFT CAPSA NETWORK ANALYZER

2015年11月10日 没有评论

ARP attacks and ARP flooding are common problems small and large networks are faced with. ARP attacks target specific hosts byusing their MAC address and responding on their behalf, while at the same time flooding the network with ARP requests. ARP attacks are frequently used for ‘Man-in-the-middleattacks, causing serious security threats, loss of confidential information and should be therefore quickly identified and mitigated.

During ARP attacks, users usually experience slow communication on the network and especially when communicating with the host that is being targeted by the attack.

In this article, we will show you how to detect ARP attacks and ARP flooding using a network analyzer such as Colasoft Capsa.

Colasoft Capsa has one great advantage – the ability to identify and present suspicious ARP attacks without any additional processing, which makes identifying, mitigating and troubleshooting much easier.

Download your copy of Colasoft Capsa and discover how easy it is to identify network & security related problems.

The Diagnosis tab provides real-time information and is extremely handy in identifying potential threats, as shown in the screenshot below:

capsa-network-analyzer-discover-arp-attacks-flooding-1

Figure 1. ARP Scan and ARP Storm detected by Capsa’s Diagnosis section.

Under the Diagnosis tab, users can click on the Events area and select any suspicious events. When these events are selected, analysis of them (MAC address information in our case) will be displayed on the right as shown above.

In addition to the above analysis, Capsa also provides a dedicated ARP Attack tab, which is used to verify the offending hosts and type of attack as shown below:

capsa-network-analyzer-discover-arp-attacks-flooding-2

Figure 2. ARP Attack tab verifies the security threat.


We can extend our investigation with the use of the Protocol tab, which allows us to drill into the ARP protocol and see which hosts MAC addresses are involved in heavy ARP protocol traffic:

capsa-network-analyzer-discover-arp-attacks-flooding-3

Figure 3. Drilling into ARP attacks.

Finally, double-clicking on a MAC address in the ARP Protocol section will show all packets related to the selected MAC address.

When double-clicking on a MAC address, Capsa presents all packets captured, allowing us to drill-down to more useful information contained in the ARP packet.

capsa-network-analyzer-discover-arp-attacks-flooding-4

Figure 4. Drilling-down into the ARP attack packets.

By selecting the Source IP, in the lower window of the selected packet, we can see the fake IP address 0.136.136.16. This means that any host on the network responding to this packet will be directed to an incorrect and non-existent IP address, indicating an ARP attack of flood.

Download your copy of Colasoft Capsa and discover how easy it is to identify network & security related problems.

If you’re a network administrator, engineer or IT manager, we strongly suggest you try out Colasoft Capsa today and see how easy you can troubleshoot and resolve network problems and security threats such as ARP Attacks and ARP Flooding.

from: http://www.firewall.cx/general-topics-reviews/colasoft/capsa-network-analyzer/1113-capsa-network-analyzer-discover-arp-attacks-flooding.html


Capsa network analyzer review

2015年10月12日 没有评论
Capsa.png

Capsa network analyzer review from wireshark.com.

Capsa is a powerful network analyzer for Ethernet analysis, troubleshooting and monitoring. Not only does it provide users with a series of powerful features that help them learn more about improving network security, pinpoint network issues and monitor network activities, but it also features a user-friendly interface that makes using it a breeze. The software is generally targeted at computer professionals and/or teachers who want to learn more about networking technology, protocols, monitoring and security.


Real time monitoring

As a packet sniffer, Capsa is capable of real time packets monitoring and can also presents the data visually by using logs and a GUI for future reference. Given the fact the software is capable if easily analyzing and diagnosing problems on a network, it can tell the user in minutes what is causing it to be slow or if there is an attack that may be the culprit for its poor performance.

In identifying network issues, Capsa can find the top ten local hosts that slow down the network and can also detect whether someone is using a Bit torrent client to download files off the web which is obviously a prime cause of slow network performance.

Safety and security

Should an attack be responsible for the network’s poor performance, the software will immediately locate the packet info and source codes from the host so that the admin can promptly begin investigating the issue. There are 2 types of worms the software can locate, including operating system works and E-mail worms. This functionality is paramount in identifying the infected computers which eventually allows the admin to fix these issues.

Available filters

In order to be able to focus on specific packets, administrators can use a wide range of filters right from Capsa’s dashboard. For instance, admins can monitor real time messages, http requests, E-mail messages and more of the 4 most popular IM apps including YM, ICQ, AIM and MSN.

Other features

There are of course many other features that Capsa incorporates, such as the ability to generate reports of a certain group or global networks automatically, but also customize the data on different charts. As a network administrator, you can also use the software to remotely monitor traffic by installing the application on the business network (on a workstation of course) and using the Remote Desktop Access function.

Conclusion

All in all, Capsa is by far one of the most reliable and simply the best network analyzers out there. Not only does it offer a wide range of improvements that make using it a breeze, but it makes it very easy for anyone who uses it to find the info they need. On top of that, thanks to functions such as reports, Matrix and Diagnosis, it definitely stands out from the large crowd of similar programs available today.

Source

Improve Network Efficiency With Colasoft Capsa Conversation Colorization Feature

2015年10月10日 没有评论

Troubleshooting network problems can be a very difficult and challenging task. While most IT engineers use a network analyzer to help solve network problems, whenanalyzing hundreds or thousands of packets, it can become very hard to locate and further research conversations between hosts. Colasoft’s Capsa v8 now introduces a new feature that allows us to highlight-colorize relevant IP conversations in the network based on their MAC address, IP Addresses, TCP or UDP conversations.

Download your copy of Colasoft Capsa v8 and discover how easy it is to identify network related problems.

This great new feature will allow IT engineers to quickly find the related packets of the conversations they want to analyze emphatically, using just a few clicks.

As shown in the screenshot below, users can colorize any Conversation in the MAC Conversation View, IP Conversation View, TCP Conversation View and UDP Conversation View. Packets related to that Conversation will be colorized automatically with the same color.

Take TCP conversation for example, choose one conversation, right-click it and choose “Select Conversation Color” in the pop-up menu:

Figure 1. Selecting a Conversation Color in Capsa v8.0

Next, select the color you wish to use to highlight the specific conversation:

Figure 2. Selecting a color

Once the color has been selected, Capsa will automatically find and highlight all related packets of this conversation using the same background color:

Figure 3. Colasoft Capsa automatically identifies and highlights the conversation

The relevance between a conversation and its packets is enhanced by colorizing packets which greatly improves analysis efficiency.

If you’re a network administrator, engineer or IT manager, we strongly suggest you try out Capsa and see how easy you can discoverand resolve network problems.

From: http://www.firewall.cx/general-topics-reviews/colasoft/capsa-network-analyzer/1106-colasoft-capsa-colorization-feature-improve-network-analysis.html


How to Use Multi-Segment Analysis to Troubleshoot Network Delay and Packet Loss

2015年10月8日 没有评论

Troubleshooting network problems can be a very intensive and challenging process. Intermittent network problems are even more difficult to troubleshoot as the problem occurs at random timeswith a random duration, making it very hard to capture the necessary information, perform troubleshooting, identify and resolve the network problem.

While Network Analyzers help reveal problems in a network data flow, they are limited to examining usually only one network link at a time, thus seriously limiting the ability to examine multiple network segments continuously.

Colasoft’s nChronos is equipped with a neat feature called multi-segment analysis, providing an easy way for IT network engineers and administrators to compare the performance between different links. IT network engineers can improve network performance by enhancing the capacity of the link according to the comparison.

Let’s take a look how we can use Colasoft nChronos’s multi-segment analysis feature to help us detect and deal effectively with our network problems.

Multi-segment analysis provides concurrent analysis for conversations across different links, from which we can extract valuable information on packet loss, network delay, data retransmission and more.

To being, we open nChronos Console and select a portion of the trend chart in the Link Analysis window, then from the Summary window below, we right-click one conversation under the IP Conversation or TCP Conversation tab. From the pop-up menu, selectMulti-Segment Analysis to open the Multi-Segment Analysis window:

Figure 1. Launching Multi-Segment Analysis in nChronos

In the Multi-Segment Analysis window, select a minimum of two and maximum of three links, then choose the stream of interest for multi-segment analysis:

Figure 2. Selecting a stream for multi-segment analysis in nChronos

When choosing a conversation for multi-segment analysis, if any of the other selected network links has the same conversation, it will be selected and highlighted automatically. In our example, the second selected link does not have the same data from the primary selected conversation and therefore there is no data to display in the lower section of the analysis window.

Next, Click Start to Analyze to open the Multi-Segment Detail Analysis window, as shown in the figure below:

Figure 3. Performing Multi-Segment analysis in nChronos

The Multi-Segment Detail Analysis section on the left provides a plethora of parameter statistics (analyzed below), a time sequence chart, and there’s a packet decoding pane on the lower right section of the window.

The left pane provides statistics on uplink and downlink packet loss, uplink and downlink network delay, uplink and downlink retransmission, uplink and downlink TCP flags, and much more.

The time sequence chart located at the top, graphically displays the packet transmission between the network links, with the conversation time displayed on the horizontal axis.

When you click on a packet on the time sequence chart, the packet decoding pane will display the detailed decoding information for that packet.

Using the Multi-Segment Analysis feature, Colasoft’s nChronos allows us to quickly compare the performance between two or morenetwork links. If you’re a network administrator, engineer or IT manager, we strongly suggest you try out nChronos today and see how easy you can discover and deal with network problems.

from: http://www.firewall.cx/general-topics-reviews/colasoft/nchronos-forensic-analysis/1105-network-troubleshooting-multi-segment-analysis-with-nchronos.html


Colasoft Capsa Free is a comprehensive network analyzer

2015年10月8日 没有评论

By Mike Williams

Colasoft Capsa 8 Free is a powerful tool for monitoring and analyzing network traffic, the free version of an enterprise package normally costing from $695.

The program has a vast and lengthy list of features, yet it’s also accessible to regular users. Just choosing an adapter and clicking “Start” gets you an attractive dashboard, with graphs showing network utilization, traffic, and top traffic by protocol and domain (keep in mind that Wi-Fi devices can’t be monitored in the free edition).

That’s just the start. Click the Summary tab and you’ll see the data behind the charts, the total numbers of IP and MAC addresses used in this session, the various protocols, DNS queries and responses, SMTP/ POP3/ IMAP 4 connections and a whole lot more.

Maybe you want to zoom in? Choosing one of the Conversation tabs — TCP, say — allows you to drill down, see which packets went to/from which addresses, the packet size, time sent, and more.

Colasoft Capsa 8 Free captures data packets, too, so you’re not restricted to summaries. Selecting any of these items displays the individual packets, and you can choose one, view any text it contains (maybe the password in a POP3 exchange, say). There’s even a detailed breakdown of the exchange, so for example you might view an IP packet to check its IP flags or TTL value.

This level of analysis isn’t just for a few internet standards, either. The program understands and can decode hundreds of protocols, and show you precisely what’s happening in every exchange.

Unsurprisingly, considering the full Enterprise version costs $995, the free build has a lot of restrictions. No monitoring of Wi-Fi devices, only one network adapter may be monitored, only one capture project can be run at a time, that’s limited to 4 hours maximum, only the first 10 private IP addresses will be analyzed, and so on.

Colasoft Capsa 8 Free has more than enough functionality left to make it interesting, though, for everyone from casual users to network experts. Give it a try.

from: http://betanews.com/2015/07/13/colasoft-capsa-free-is-a-comprehensive-network-analyzer/#comments

How to Detect Routing Loops and Physical Loops with a Network Analyzer

2015年7月28日 没有评论

When working with medium to large scale networks, IT departments are often faced dealing with network loops and broadcast storms that are caused by user error, faulty network devices or incorrect configuration of network equipment.  Network loops and broadcast storms are capable of causing major network disruptions and therefore must be dealt with very quickly.

There are two kinds of network loops and these are routing loops and physical loops.

Routing loops are caused by the incorrect configuration of routing protocols where data packets sent between hosts of different networks, are caught in an endless loop travelling between network routers with incorrect route entries.

A Physical loop is caused by a loop link between devices. A common example is two switches with two active Ethernet links between them. Broadcast packets exiting the links on one switch are replicated and sent back from the other switch. This is also known as a broadcast storm.

Both type of loops are capable of causing major network outages, waste of valuable bandwidth and can disrupt network communications.

We will show you how to detect routing loop and physical loop with a network analyzer such as Colasoft Capsa or Wireshark.

We’ve selected Colasoft Capsa 8.0 as our preferred packet analyzer because of its new feature that allows the quick diagnosis of routing loops and physical loops.

If there are routing loops or physical loops in the network, Capsa will immediately report them in the Diagnosis tab as shown below. This makes troubleshooting easier for network managers and administrators:

how-to-detect-routing-and-physical-loops-using-a-network-analyzer-01

Figure 1. Capsa quickly detects and displays Routings and Physical Loops

Further examination of Capsa’s findings is possible by simply clicking on each detected problem. This allows us to further check the characteristics of the related packets and then decide what action must be taken to rectify the problem.

DRILLING INTO OUR CAPTURED INFORMATION

Let’s take a routing loop for example. First, find out the related conversation using Filter (red arrow) in the MAC Conversation tab. MAC addresses can be obtained easily from the notices given in the Diagnosis tab:

how-to-detect-routing-and-physical-loops-using-a-network-analyzer-02

Figure 2. Obtaining more information on a Routing Loop problem

Next, Double-click the conversation to load all related packets and additional information. Click on Identifier, to view the values of all packets under the Decode column, which in our case are all the same, This effectively means that the packets captured in our example is the same packet which is continuously transiting our network because its caused in a loop.  For example, Router-A might be sending it to Router-B, which in turn sends it back to Router-A.

how-to-detect-routing-and-physical-loops-using-a-network-analyzer-03

Figure 3. Decoding packets caught in a routing loop

Now click on the Time To Live section below, and you’ll see the Decode value reduces gradually. It is because that TTL value will decreased by 1 after transiting a routing device. When TTL reaches the value of 1, the packet will be discarded, to help avoid ICMP packets travelling indefinitely in case of a routing loop in the network. More information on the ICMP protocol can be found in our ICMP Protocol page:

how-to-detect-routing-and-physical-loops-using-a-network-analyzer-04

Figure 4. Routing loop causing ICMP TTL to decrease

The method used to analyze physical loops is almost identical, but the TTL values of all looped packets remain the same, instead of decreasing as we previously saw. Because the packet is trapped in our local network, it doesn’t traverse a router, therefore the TTL does not change.

Below we see a DNS Query packet that is trapped in a network loop:

how-to-detect-routing-and-physical-loops-using-a-network-analyzer-05

Figure 5. Discovering Network loops and why their TTL values do not decrease

Advanced network analyzers such as Colasoft’s Capsa allows us to quickly detect serious network problems that can cause network outages, packet loss, packet flooding and more. If you’re a network administrator, engineer or IT manager, we strongly suggest you try out Capsa v8 today and discover how easy you can discover and deal with network problems.

View more:http://www.firewall.cx/networking-topics/general-networking/1102-how-to-detect-routing-and-physical-loops-using-a-network-analyzer.html

THE IMPORTANCE OF A NETWORK ANALYZER – PACKET SNIFFER. MUST-HAVE FEATURES FOR DEMANDING ENGINEERS & ADMINISTRATORS

2015年4月22日 1 条评论

Network Analyzers, also known as Packet Sniffers, are amongst the most popular network tools found inside any Network Engineer’s toolkit. A Network Analyzer allows users to capture network packets as they flow within the enterprise network or Internet.

Engineers usually make use of Network Analyzers to help uncover, diagnose andfix network problems, but they are also used by hackers to obtain access tosensitive information and user data.


FEATURES OFFERED IN HIGH-QUALITY NETWORK ANALYZERS

When dealing with network problems, engineers usually follow standard tests to try to identify the source of the problem and make any necessary corrections. These tests usually involve checking the source (Client or Network device) IP address, Gateway, DNS server, Nslookup and performing a few ICMP Echo Requests (aka Ping) to verify connectivity with the local network and destination IP.

These methods are usually enough to diagnose simple problems, but are clearly inadequate when dealing with complex network problems. This is where a high-quality network analyzer comes into play.

Any typical network analyzer will capture and display packets, providing basic packet information such as time of capture, source & destination MAC address, source & destination IP address, Layer 4 protocol information (TCP/UDP flags, ports, sequence/acknowledgement numbers) and the data payload. While this information is extremely useful information, it often means that additional time is required by the engineer to locate the data stream/conversation of interest and track down all associated packets.

Further analysis of the captured data usually increases the difficulty and expertise level required to make sense of the information captured.

Let’s take a look at the most important features high-end network analyzers have, that helps simplify complex troubleshooting in our everyday routine.

Download your copy of Capsa Enterprise Network Analyzer now!

REAL-TIME NETWORK CARD UTILIZATION

Real-time network card utilization is a very handy ‘visual tool’ as it shows the bandwidth utilization of the network card used to capture packets.

When configuring SPAN on Cisco Catalyst switches to monitor a switchport that connects to a router or server, the real-time visual representation of network traffic has proven to be extremely useful as it’s much easier spot packet bursts and other traffic patterns.

important-network-analyzer-packet-sniffer-features-1

Figure 1. Capsa Enterprise real-time network utilization

CONFIGURABLE BUFFER SIZE

All traffic captured by the network analyzer is stored in a special buffer. This buffer usually resides in the workstation’s RAM and can be saved on the hard disk, so that additional analysis can be performed later. While most packet analyzers allow the buffer size to changed, its size is usually restricted to a few MB.

The ability to use an extremely large capture buffer e.g 1024MB or 1 Gigabyte, is necessary when performing analysis of heavy traffic where a couple of hundreds of MBs are typically required.


IP CONVERSATION TRACKING & TRANSACTION SEQUENCE DIAGRAMS

A high-quality network analyzer smartly presents all captured information in an easy-to-understand manner, making it easy and fast to locate any IP Conversation between hosts:

important-network-analyzer-packet-sniffer-features-2

Figure 2. Capsa Enterprise displays IP Conversations between our workstation and Firewall.cx

Having the ability to drill-down into each IP Conversation is equally important. Colasoft Capsa provides this important feature by simply double-clicking on any of the displayed conversations:

important-network-analyzer-packet-sniffer-features-3

Figure 3. Capsa Enterprise allows us to drill-into each IP Conversation

The Transaction Sequence Diagram section on the left side displays the flow of packets of the displayed IP Conversation. Tracking TCP sequence numbers and TCP acknowledgements is often a very time-consuming process but tools such as Capsa Enterprise makes it easy and allows engineers to focus on the more important information.


AUTOMATIC DIAGNOSTIC TOOLS

Network engineers often need to deal with network problems that occur either from user configuration errors (e.g invalid Domain, incorrect URL etc) or other problems that are often difficult to identify.

Considering the fact your network analyzer captures all traffic, it should be able to automatically identify network/session problems anderrors. This helpful feature helps dramatically when dealing with various network issues as it provides an overall view of problems that have been identified.

In many cases, these errors can lead to uncovering suspicious user activity or hacking attempts:

important-network-analyzer-packet-sniffer-features-4
Figure 4. Capsa Enterprise automatically identifies problems that would otherwise be missed

As shown in the screenshot above, our network analyzer has identified 36 events that can be examined by double-clicking on the specific event in the left window and then selecting the associated addresses from the right window. Packets are then displayed at the bottom area. Double-clicking on these packets will open them for further examination.


TOP NETWORK TALKERS

During times of excessive traffic, it is usually required to identify the network’s top talkers and take action. When supported by the network analyzer, it makes life very easy. When not supported, a sample of network traffic must be taken and sorted by the IP address with the greatest amount of data transferred.

important-network-analyzer-packet-sniffer-features-5

Figure 5. Capsa Enterprise provides the network’s top talkers and their traffic

Capsa provides 4 reports of Top Talkers: Top100 IPv4 Nodes (shown above), Top100 IPv4 Conversations (IP Based), Top100 Physical Nodes (MAC Based) and Top100 Physical Conversations (MAC Based).

Top IP’s can also be obtained via Capsa’s Dashboard (shown below) which provides Global Utilization (% of total interface bandwidth) and Traffic (bytes) within a specific timeframe, Top IPs based on bytes transferred, and Top Application Protocols based on the protocol used:

important-network-analyzer-packet-sniffer-features-6
Figure 6. Capsa’s Dashboard provides a healthy amount of real-time information and traffic captured

ADVANCED FILTERING

Filtering is a core feature that allows network engineers to select specific type of traffic based on its characteristics. Common filtering found on most network analyzers includes: Source/Destination MAC or IP address, Protocol and Port numbers.

Advanced filtering is a feature most engineers require in their network analyzer, but often don’t have. Advanced filtering allows special complex filters to be created based on additional characteristics such as Time, Packet size, Data Payload values in conjunction with AND/OR/NOT logical operations.

important-network-analyzer-packet-sniffer-features-7

Figure 7. Capsa’s Advanced Filtering leaves nothing to be desired

CONCLUSION

A high-quality network analyzer bundled with useful advanced features as the above will help any engineer or administrator diagnoseand deal with network problems quickly and efficiently, but also capture suspicious network traffic patterns often associated withhacking attempts. When selecting your network tools, ensure they are of the highest quality and provide features that will help make your job easier.

from: http://www.firewall.cx/networking-topics/general-networking/1084-important-network-analyzer-packet-sniffer-features.html


分类: Articles, Reviews, Tips & How-tos 标签:

Capsa by Colasoft: A Network Engineer’s Product Review

2015年2月9日 没有评论

By Shane Killen

I wanted to take the opportunity to do a review of the Colasoft Capsa program.  I have been asked about this program often, and I think it is time I do a review. Everyone knows that I like this program and I personally use this network analyzer all the time in my consulting position.  I love it and I have recommended this program on my blog and to customers of the company I work for.  It has saved me time and money in diagnosing problems.  And if I’m saving money, that means my customers are saving money.  And everyone loves that!

A personal story:
Just to start this out, I want to tell you a quick, condensed story.  I had a customer that called me up one morning.  They told me that their network was “crawling” and they wanted to know if I knew of anything going on.  I was at another client at the time, and all I knew to say at that point was that I could come over and take a look.  They told me to hold off at the moment, and they would call me if you needed me.  By the time 4PM came, I called that customer back to see what they had found.  He told me that they still had the problem, and they wanted me to come on in and see if I could find the problem.  I did just that.  From the time I got there and started working on the problem, I set up a monitor session and connected my laptop up.  Within 10 minutes, I told them what was the problem, what was causing the problem, and how it needed to be resolved.  It was a device that had a NIC that started flooding the network.  180K packets per second (Capsa told me this).  They went and disconnected the offending network cable for the device, and everything came back up without issue.  Key NOTE:  They had been working all day on this problem without resolution.  I came in and within 10 minutes pointed out what the problem was, what was causing the problem, and what to do to fix it.  I was able to do this with the Capsa network analyzer within 10 minutes of starting the troubleshooting.  In this example, think of how much money and productivity was lost. The very next day, this customer bought Capsa.

Now, the review:
At first look, the Capsa dashboard has a very nice look and feel to it. The dashboard colors are easy on the eyes when looking at it for long periods time, which is important when needing to troubleshoot problems.  You don’t need something hard to look at on top of using your brain to pinpoint issues, and Capsa is certainly easy on the eyes.  See below for the first look.

The layout is also well designed.  The tabs across the display make it easy to navigate to areas you need to get to.  Its almost like the company had true technical engineers design the layout.

The first display I tend to look at and use is the default view.  You can easily customize this to whatever it is you are looking for.  Capsa puts out some displays for you by default.  The defaults are good, but if you need more for what you are trying to accomplish, they made it very easy to add to this display if you want to.  I personally modify it to what I like to see.

The “Summary” tab has very good statistical information in it.  I personally dont use this tab much, but if you are looking for general statistical information about your network, this is a good place to view.  I do know engineers that just want to take samplings on a network, and this is a good tab to view for just that.  Things like Diagnosis statistics, Traffic statistics, Packet size Distribution statistics, Protocol statistics by OSI model, etc.  Again, very good for taking statistical snapshots during timed intervals.

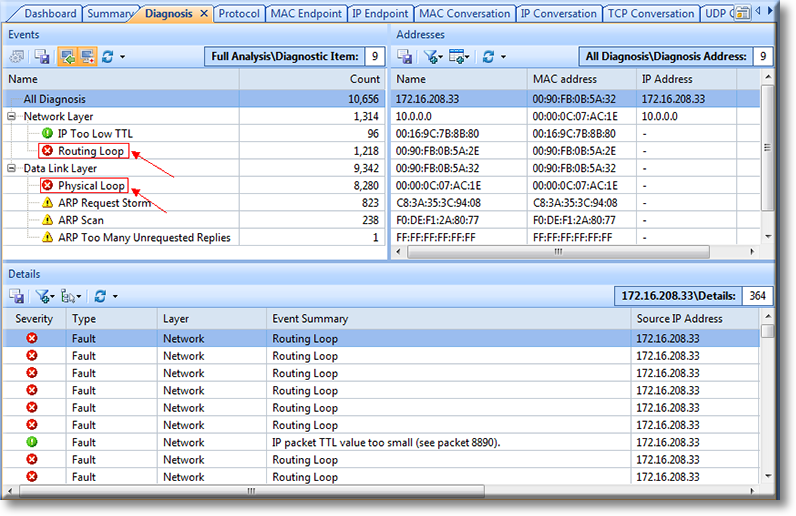
This next tab is really handy for doing network assessments.  Its called the “Diagnose” tab, and this tab will tell you potential problems on the network that Capsa sees.  Anything from delays, re-transmissions, SMTP server slow response, HTTP client error, etc. And when I say “etc”, I mean a lot of “etc”s.  I use this all the time, and its very handy and helpful for the network engineer.  Its handy because it even makes suggestions on what the actual problem resolution might be.  That is a pretty cool feature.

The next tab shows a “Protocol” view of the network.  This is an excellent view into what protocols are traversing your network.  If you see a protocol in this display that you didn’t want on the network, this is a great place to see it quickly.  Easy to see and right in front of your eyes without the need to sift through traffic or selecting a column view and then finding the protocol.  Its just right in front of you with ease to see.  This is very helpful when in a hurry to hunt down what you don’t want on the network, as far as protocol view is concerned.  I have had plenty of times when trying to see what protocol is running on a network, just to know for sure what is there and what is not there.  And when Im doing a deep inspection of a network, this is definitely one view I look at.

The “Physical Endpoint” tab gives you a view into the layer 2 and layer 3 view into the network for statistics.  I personally don’t use this view much.  However, I do see the benefit of this tab.  You can find problems by either MAC address or IP address, like a malfunctioning NIC.  This is a good statistical view of that.  I personally will see it in the default view, because Ill customize the view there to see such things.  But, this is also a great place for that sort of detail.  One thing I really like about this view is that you can see the actual packets if you choose to.  Just like what you would see in a wireshark packet capture.  This is a great feature.

The “IP Endpoint” is a layer 3 view only into this view.  Its very similar to the “Physical Endpoint” tab, with the same features for the most part.  This is mostly a statistical view.  Again, you can see the actual packet here if you want to see it, just like in wireshark.  I have used this screen to find packets from a particular IP address, so that I can use the packet view before.  This is very handy and easy to find what you are looking for if you are looking for a particular IP address.  From the “offender”, you can view all you want as far as raw packets go.  I personally like this and have used this often in the past.

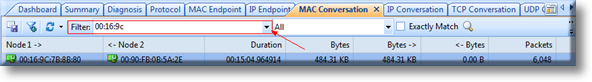
The “Physical Conversation” and “IP conversation” tabs has some important information for troubleshooting delays, etc.  I personally have used this tab a lot, especially when looking for delays in traffic to find out what is actually happening.  There is a lot of good information in these tab views.

The “TCP Conversation” view is an excellent view for seeing delays, etc.  In application type delays, you can easily prove where delta delays are when everyone is pointing at the network as fault.  I have used this many times to prove application delays, and where the network was fine.  This view makes it very easy to see these types of delays with transaction sequence diagrams, along with seeing the actual packet if you want to (which I do).  Again, it just makes it easy.  See below for a screenshot.

The “UDP Conversation” view is similar, with the exception of a data flow view.  After all, its UDP.  I personally dont utilize this tab much.  Although, I do see the value in seeing the conversations between devices.

There is now a new section called “VoIP Call” tab.  I have experimented with this and I do like this tab.  It will show you the calls made via SIP, the status of the calls, duration, invite time, etc.  It even has a “translatorX” like view if you are a visual person and want to see the call setup steps that each call has taken.  This is especially helpful when troubleshooting failed SIP calls.  This is a welcomed addition to the Capsa package.  With that said, I must tell you that for now, it only will recognize SIP calls.  It will not recognize H323, MGCP, or SCCP.  I have to admit, that is a little disappointing.  However, that is really the only negative thing I can say about this tab.  But, I suspect that will change in the future.  But, keep in mind, you can still view H323, MGCP, and SCCP in the other tabs if you looking for them.  Its just not in this tab.  Overall, I’m still impressed with this VoIP capability.  I’d really like to show you this screen, but there is just too much sensitive information I cant give out in my capture.  So I’m only going to show you a piece of the screen, so that you get the idea of what you will see.  I did blot out the personal info on this screenshot, but again, there is more to this screen than what I’m showing below.

There is a new “Ports” tab that shows all the ports being used on the network.  From here, you can view the traffic conversations, along with the data flows.  Again, this is really important in finding delays, etc.  I really like this new addition to the Capsa product.

There is a “Matrix” tab which shows you in a circular diagram the traffic from source to destination.  I dont use this much, except to get an impression on how many devices are actually talking to each other.  From here, you can, again, look at the raw packets.  I have heard other engineers say they like this view.  I think this must be just personal preference.

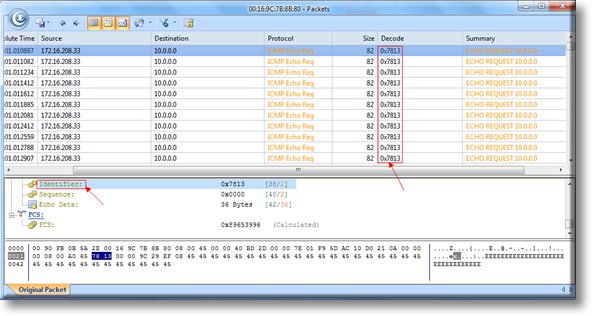
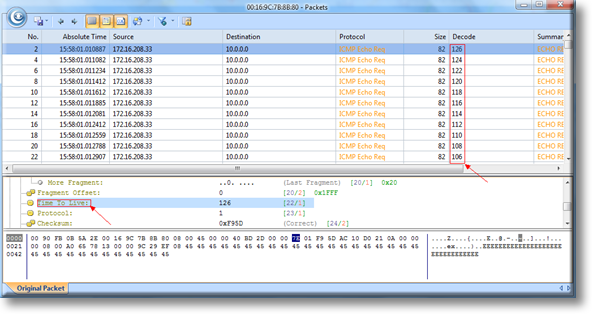
The “Packet” tab takes you right to the raw packet view.  Again, this is convenient, as you can go directly to search for specific IPs or MAC addresses quickly. And again, with all the info you would need in the display for finding what you want in the packet capture.

The “Log” view is just that.  It shows you a log of successful and failed events.  Anything from a global view of all traffic, to seeing only DNS, Email, HTTP, etc types of traffic.  This is an excellent addition to the product when you need to see events outside a packet view.

The last tab is called “Report”.  I absolutely love this tab.  For the executives, you can run the reports they want to see without them actually being technical in nature.  Lets face it, they just want the high level overview.  They dont want to see the packet details, the troubles, etc.  They just want the facts, and these canned reports will give them just that.  Also, you can customize your own reports as well.  You can even customize this to your company name, logo, etc.  This is a nice feature.

Other features:
You can get Capsa to send you an audible alarm when an event happens, something you customize yourself.  You can also get it to send you an email when the event happens, if you happen to not be in front of your Capsa PC/Server.

I also like the displays across the top of the program.  I use the “utilization” and “pps” (packets per second) displays almost every time I use Capsa.  These views are easy to detect broadcast storms, over utilization, etc. There is also a “Traffic Chart (bps)” chart that is a visual of the amount of traffic that is on the network.  I like these views for sure.  They are always up front and if something starts happening on the network, you can easily see some of these types of events in these displays.  Very handy when you are going through the tabs and still able to see these views at the top.  I personally like that this was carefully thought of for the network engineer.

Another thing I like, is that if you are looking for only certain types of traffic, you can filter Capsa to only display that traffic without seeing all the other traffic you are not looking for.  This is handy when you know where the problem is, but dont know the cause of the problem.

One thing to note here in this review.  I have mentioned a lot of features in this program.  However, what I have not mentioned is ALL of the capabilities in each tab.  There are a ton of things you can do in most of the tabs.  Don’t think I covered everything.  I have only covered a fraction of what you get out of this product. What I suggest is that you go and download a demo of this product.  Try it for yourself and download a trial of this to see if you like it.  Visit Colasoft at www.colasoft.com, and let me know how you like it.

About Shane Killen

Shane Killen currently works at a consulting company in Birmingham, Alabama.  It is a consulting firm that deals with most aspects of IT Technology.
He works as a IT consultant, serving as a Senior Network Engineer. Shane Killen has been working in IT professionally since 1996.  Certifications currently hold –  Cisco CCNP (R&S), Cisco CCNP Voice, Cisco CCDP, Brocade BCNP, ShoreTel Advance Systems and Troubleshooting, CompTIA Network+, CompTIA A+, CSSA, Palo Alto ACE.

From: http://www.shanekillen.com/2015/02/capsa-by-colasoft-product-review.html

Review: Colasoft Capsa Network Analyzer Enterprise Edition 7.8 – software.informer.com

2014年10月15日 没有评论

Colasoft Capsa Enterprise is a network management solution aimed at small and medium-sized businesses and network administrators. This network traffic analyzer lets users monitor, detect, and troubleshoot network issues in a fast and simple manner. Among the powerful features this edition of Capsa includes is the ability to monitor both Ethernet and wireless networks.

As a comprehensive network sniffer, Capsa Enterprise is able to perform different types of analysis and tests over one or multiple wired and wireless connections (like 802.11a/b/g/n). It lets you run analysis of specific aspects of your network or a full Test providing an exhaustive level of detail. Capsa is able to perform packet capture in real time, monitor traffic, run security analysis to detect potential security risks, map the traffic and MAC, IP addresses of every host on the network, as well analyse different protocols like HTTP, FTP, and DNS, and applications like IM, Email (POP3, IMAP4, SMTP), and VoIP, letting you log and save data to disk. These complex tasks are carried out in a fast and simple way, with literally a few clicks.

Besides its straightforward interface, it is worth highlighting the way Capsa displays the data obtained by means of graphs, charts, and statistics that are easy to read and interpret, letting users detect and address potential issues in the most effective way. With the analysis results ordered in tabs and the several filters available it is easy to find the information you want to focus on. The Dashboard is the first section you will see once the analysis is on; and there are several view modes to choose from, including the possibility of adding or removing panels. Another tab that deserves particular mention is the Matrix tab, which maps network traffic between network nodes in a graph.

Other tools available in the pack include Packet Player, Packet Builder, Ping, and MAC Scanner, the possibility of scheduling tasks and adding alarms.

To sum up, Colasoft Capsa Enterprise is a tool that combines powerful features with in-depth analysis and statistics, essential for network adminitrators and engineers. This network sniffer has a cost of $995 and the free demo version is fully functional for 15 days.

Pros

  • Comprehensive network analyzer with powerful features.
  • In-depth network analysis.
  • Data is displayed in easy-to-read graphs.
  • User-friendly.

Cons

  • None.
Download Capsa
 
       from:  http://colasoft-capsa-enterprise.software.informer.com/