存档

‘Tips & How-tos’ 分类的存档

Detect Brute-Force Attacks With nChronos Network Security Forensic Analysis Tool

2016年3月29日 没有评论

Brute-force attacks are commonly known attack methods by which hackers try to getaccess to restricted accounts and data using an exhaustive list/database of usernamesand passwords. Brute-force attacks can be used, in theory, against almost any encrypted data.

When it comes to user accounts (web based or system based), the first sign of a brute-force attack is when we see multiple attempts to login to an account, therefore allowing us to detect a brute-force attack by analyzing packets that contain such events. We’ll show you how Colasoft’s nChronos can be used to identify brute-force attacks, and obtain valuable information that can help discover the identity of the attacker plus more.

For an attacker to obtain access to a user account on a website via brute force, he is required to use the site’s login page, causing an alarming amount of login attempts from his IP address. nChronos is capable of capturing such events and triggering a transaction alarm, warning system administrators of brute-force attacks and when the triggering condition was met.

CREATING A TRANSACTION ANALYSIS & ALARM IN NCHRONOS

First, we need to create a transaction analysis to specify the pattern/behavior we are interested in monitoring:

From the nChronos main page, first select the server/IP address we want to monitor from the Server Explorer section.

Next, from the Link Properties, go to the Application section and then the Analysis Settings as shown below:

colasoft-nchronos-brute-force-attack-detection-2a

Figure 1. Creating a Transaction Analysis in nChronos (click to enlarge)

Now click the button of New Web Application (second green button at the top) to set a Web Application, input Name and HTTP Hostname, then check the box labeled Enable Transaction Analysis and add a transaction with URL subpath e.g “/login.html”.

Proactively monitor your network 24/7 for attacks, suspicious network traffic and problems – Download nChronos now!

At this point we’ve created the necessary Transaction Analysis. All that’s required now is to create the Transaction Alarm.

To create the alarm, click Transaction Alarms in the left window, input the basic information and choose the parameter of Transaction Statistics in Type, and then set a Triggering Condition as needed, for example, 100 times in 1 minute. This means that the specific alarm will activate as soon as there are 100 or more logins within a minute:

colasoft-nchronos-brute-force-attack-detection-3a

Figure 2. Creating a Transaction Alarm (click to enlarge)

Finally, you can choose Send to email box or Send to SYSLOG to send the alarm notification. Once complete, the transaction alarm fordetecting brute-force attack is set. When the alarm triggering condition is met an email notification is sent.

Note that the specific alarm triggering condition does not examine the amount of logins per IP address, which means the alarm condition will be met regardless if the 100 login attempts/min is from one or more individual IP addresses. This can be manually changed from theTransaction Analysis so that it shows the login attempt times of each individual IP address.

Below is a sample output from an alarm triggered:

colasoft-nchronos-brute-force-attack-detection-3a

Figure 3. nChronos Brute-Force alarm triggered – Overall report (click to enlarge)

And below we see the same alarm with a per-IP address analysis:

colasoft-nchronos-brute-force-attack-detection-4a

Figure 4. nChronos Brute-Force alarm triggered – IP breakdown (click to enlarge)

The article shows how nChronos can be used to successfully detect a Brute-Force attack against any node on a network or evenwebsites, and at the same time alert system administrators or IT managers of the event. If you’re a network administrator, network engineer or IT manager, we strongly suggest you try out Colasoft nChronos today and see how easily you can troubleshoot network problems, proactively obtain alerts on unusual network traffic and monitor your network around the clock.

from: http://www.firewall.cx/general-topics-reviews/colasoft/nchronos-forensic-analysis/1139-nchronos-brute-force-attack-detection.html


HOW TO DETECT ARP ATTACKS & ARP FLOODING WITH COLASOFT CAPSA NETWORK ANALYZER

2015年11月10日 没有评论

ARP attacks and ARP flooding are common problems small and large networks are faced with. ARP attacks target specific hosts byusing their MAC address and responding on their behalf, while at the same time flooding the network with ARP requests. ARP attacks are frequently used for ‘Man-in-the-middleattacks, causing serious security threats, loss of confidential information and should be therefore quickly identified and mitigated.

During ARP attacks, users usually experience slow communication on the network and especially when communicating with the host that is being targeted by the attack.

In this article, we will show you how to detect ARP attacks and ARP flooding using a network analyzer such as Colasoft Capsa.

Colasoft Capsa has one great advantage – the ability to identify and present suspicious ARP attacks without any additional processing, which makes identifying, mitigating and troubleshooting much easier.

Download your copy of Colasoft Capsa and discover how easy it is to identify network & security related problems.

The Diagnosis tab provides real-time information and is extremely handy in identifying potential threats, as shown in the screenshot below:

capsa-network-analyzer-discover-arp-attacks-flooding-1

Figure 1. ARP Scan and ARP Storm detected by Capsa’s Diagnosis section.

Under the Diagnosis tab, users can click on the Events area and select any suspicious events. When these events are selected, analysis of them (MAC address information in our case) will be displayed on the right as shown above.

In addition to the above analysis, Capsa also provides a dedicated ARP Attack tab, which is used to verify the offending hosts and type of attack as shown below:

capsa-network-analyzer-discover-arp-attacks-flooding-2

Figure 2. ARP Attack tab verifies the security threat.


We can extend our investigation with the use of the Protocol tab, which allows us to drill into the ARP protocol and see which hosts MAC addresses are involved in heavy ARP protocol traffic:

capsa-network-analyzer-discover-arp-attacks-flooding-3

Figure 3. Drilling into ARP attacks.

Finally, double-clicking on a MAC address in the ARP Protocol section will show all packets related to the selected MAC address.

When double-clicking on a MAC address, Capsa presents all packets captured, allowing us to drill-down to more useful information contained in the ARP packet.

capsa-network-analyzer-discover-arp-attacks-flooding-4

Figure 4. Drilling-down into the ARP attack packets.

By selecting the Source IP, in the lower window of the selected packet, we can see the fake IP address 0.136.136.16. This means that any host on the network responding to this packet will be directed to an incorrect and non-existent IP address, indicating an ARP attack of flood.

Download your copy of Colasoft Capsa and discover how easy it is to identify network & security related problems.

If you’re a network administrator, engineer or IT manager, we strongly suggest you try out Colasoft Capsa today and see how easy you can troubleshoot and resolve network problems and security threats such as ARP Attacks and ARP Flooding.

from: http://www.firewall.cx/general-topics-reviews/colasoft/capsa-network-analyzer/1113-capsa-network-analyzer-discover-arp-attacks-flooding.html


Improve Network Efficiency With Colasoft Capsa Conversation Colorization Feature

2015年10月10日 没有评论

Troubleshooting network problems can be a very difficult and challenging task. While most IT engineers use a network analyzer to help solve network problems, whenanalyzing hundreds or thousands of packets, it can become very hard to locate and further research conversations between hosts. Colasoft’s Capsa v8 now introduces a new feature that allows us to highlight-colorize relevant IP conversations in the network based on their MAC address, IP Addresses, TCP or UDP conversations.

Download your copy of Colasoft Capsa v8 and discover how easy it is to identify network related problems.

This great new feature will allow IT engineers to quickly find the related packets of the conversations they want to analyze emphatically, using just a few clicks.

As shown in the screenshot below, users can colorize any Conversation in the MAC Conversation View, IP Conversation View, TCP Conversation View and UDP Conversation View. Packets related to that Conversation will be colorized automatically with the same color.

Take TCP conversation for example, choose one conversation, right-click it and choose “Select Conversation Color” in the pop-up menu:

Figure 1. Selecting a Conversation Color in Capsa v8.0

Next, select the color you wish to use to highlight the specific conversation:

Figure 2. Selecting a color

Once the color has been selected, Capsa will automatically find and highlight all related packets of this conversation using the same background color:

Figure 3. Colasoft Capsa automatically identifies and highlights the conversation

The relevance between a conversation and its packets is enhanced by colorizing packets which greatly improves analysis efficiency.

If you’re a network administrator, engineer or IT manager, we strongly suggest you try out Capsa and see how easy you can discoverand resolve network problems.

From: http://www.firewall.cx/general-topics-reviews/colasoft/capsa-network-analyzer/1106-colasoft-capsa-colorization-feature-improve-network-analysis.html


How to Use Multi-Segment Analysis to Troubleshoot Network Delay and Packet Loss

2015年10月8日 没有评论

Troubleshooting network problems can be a very intensive and challenging process. Intermittent network problems are even more difficult to troubleshoot as the problem occurs at random timeswith a random duration, making it very hard to capture the necessary information, perform troubleshooting, identify and resolve the network problem.

While Network Analyzers help reveal problems in a network data flow, they are limited to examining usually only one network link at a time, thus seriously limiting the ability to examine multiple network segments continuously.

Colasoft’s nChronos is equipped with a neat feature called multi-segment analysis, providing an easy way for IT network engineers and administrators to compare the performance between different links. IT network engineers can improve network performance by enhancing the capacity of the link according to the comparison.

Let’s take a look how we can use Colasoft nChronos’s multi-segment analysis feature to help us detect and deal effectively with our network problems.

Multi-segment analysis provides concurrent analysis for conversations across different links, from which we can extract valuable information on packet loss, network delay, data retransmission and more.

To being, we open nChronos Console and select a portion of the trend chart in the Link Analysis window, then from the Summary window below, we right-click one conversation under the IP Conversation or TCP Conversation tab. From the pop-up menu, selectMulti-Segment Analysis to open the Multi-Segment Analysis window:

Figure 1. Launching Multi-Segment Analysis in nChronos

In the Multi-Segment Analysis window, select a minimum of two and maximum of three links, then choose the stream of interest for multi-segment analysis:

Figure 2. Selecting a stream for multi-segment analysis in nChronos

When choosing a conversation for multi-segment analysis, if any of the other selected network links has the same conversation, it will be selected and highlighted automatically. In our example, the second selected link does not have the same data from the primary selected conversation and therefore there is no data to display in the lower section of the analysis window.

Next, Click Start to Analyze to open the Multi-Segment Detail Analysis window, as shown in the figure below:

Figure 3. Performing Multi-Segment analysis in nChronos

The Multi-Segment Detail Analysis section on the left provides a plethora of parameter statistics (analyzed below), a time sequence chart, and there’s a packet decoding pane on the lower right section of the window.

The left pane provides statistics on uplink and downlink packet loss, uplink and downlink network delay, uplink and downlink retransmission, uplink and downlink TCP flags, and much more.

The time sequence chart located at the top, graphically displays the packet transmission between the network links, with the conversation time displayed on the horizontal axis.

When you click on a packet on the time sequence chart, the packet decoding pane will display the detailed decoding information for that packet.

Using the Multi-Segment Analysis feature, Colasoft’s nChronos allows us to quickly compare the performance between two or morenetwork links. If you’re a network administrator, engineer or IT manager, we strongly suggest you try out nChronos today and see how easy you can discover and deal with network problems.

from: http://www.firewall.cx/general-topics-reviews/colasoft/nchronos-forensic-analysis/1105-network-troubleshooting-multi-segment-analysis-with-nchronos.html


How to Detect Routing Loops and Physical Loops with a Network Analyzer

2015年7月28日 没有评论

When working with medium to large scale networks, IT departments are often faced dealing with network loops and broadcast storms that are caused by user error, faulty network devices or incorrect configuration of network equipment.  Network loops and broadcast storms are capable of causing major network disruptions and therefore must be dealt with very quickly.

There are two kinds of network loops and these are routing loops and physical loops.

Routing loops are caused by the incorrect configuration of routing protocols where data packets sent between hosts of different networks, are caught in an endless loop travelling between network routers with incorrect route entries.

A Physical loop is caused by a loop link between devices. A common example is two switches with two active Ethernet links between them. Broadcast packets exiting the links on one switch are replicated and sent back from the other switch. This is also known as a broadcast storm.

Both type of loops are capable of causing major network outages, waste of valuable bandwidth and can disrupt network communications.

We will show you how to detect routing loop and physical loop with a network analyzer such as Colasoft Capsa or Wireshark.

We’ve selected Colasoft Capsa 8.0 as our preferred packet analyzer because of its new feature that allows the quick diagnosis of routing loops and physical loops.

If there are routing loops or physical loops in the network, Capsa will immediately report them in the Diagnosis tab as shown below. This makes troubleshooting easier for network managers and administrators:

how-to-detect-routing-and-physical-loops-using-a-network-analyzer-01

Figure 1. Capsa quickly detects and displays Routings and Physical Loops

Further examination of Capsa’s findings is possible by simply clicking on each detected problem. This allows us to further check the characteristics of the related packets and then decide what action must be taken to rectify the problem.

DRILLING INTO OUR CAPTURED INFORMATION

Let’s take a routing loop for example. First, find out the related conversation using Filter (red arrow) in the MAC Conversation tab. MAC addresses can be obtained easily from the notices given in the Diagnosis tab:

how-to-detect-routing-and-physical-loops-using-a-network-analyzer-02

Figure 2. Obtaining more information on a Routing Loop problem

Next, Double-click the conversation to load all related packets and additional information. Click on Identifier, to view the values of all packets under the Decode column, which in our case are all the same, This effectively means that the packets captured in our example is the same packet which is continuously transiting our network because its caused in a loop.  For example, Router-A might be sending it to Router-B, which in turn sends it back to Router-A.

how-to-detect-routing-and-physical-loops-using-a-network-analyzer-03

Figure 3. Decoding packets caught in a routing loop

Now click on the Time To Live section below, and you’ll see the Decode value reduces gradually. It is because that TTL value will decreased by 1 after transiting a routing device. When TTL reaches the value of 1, the packet will be discarded, to help avoid ICMP packets travelling indefinitely in case of a routing loop in the network. More information on the ICMP protocol can be found in our ICMP Protocol page:

how-to-detect-routing-and-physical-loops-using-a-network-analyzer-04

Figure 4. Routing loop causing ICMP TTL to decrease

The method used to analyze physical loops is almost identical, but the TTL values of all looped packets remain the same, instead of decreasing as we previously saw. Because the packet is trapped in our local network, it doesn’t traverse a router, therefore the TTL does not change.

Below we see a DNS Query packet that is trapped in a network loop:

how-to-detect-routing-and-physical-loops-using-a-network-analyzer-05

Figure 5. Discovering Network loops and why their TTL values do not decrease

Advanced network analyzers such as Colasoft’s Capsa allows us to quickly detect serious network problems that can cause network outages, packet loss, packet flooding and more. If you’re a network administrator, engineer or IT manager, we strongly suggest you try out Capsa v8 today and discover how easy you can discover and deal with network problems.

View more:http://www.firewall.cx/networking-topics/general-networking/1102-how-to-detect-routing-and-physical-loops-using-a-network-analyzer.html

Find Out Who’s Eating Your Bandwidth With These Tips

2015年6月3日 没有评论

Click….wait. Click….wait. Click….ARG! Sound familiar? That’s the sound of someone running out of Internet bandwidth.

A lot of things can drain away the capacity of that pipe that connects your computer to the Internet. It could be other people or devices on your network, or it could even be malicious applications or services running on the PC itself. The problem can get so bad that some people will toss out their computer and buy a new one.

It doesn’t have to be that way. While the problem could be coming from anywhere, it isn’t impossible to troubleshoot if you know where to look, what tools to use, and what to do when you find the culprit. In this article, I’m going to give you a hand and walk you through the process of tracking down that bandwidth hog and shutting him down.

Track Down The Bandwidth Bandit Via Your Router

You could start just about anywhere when it comes to isolating the bandwidth hog on your network or inside your computer, but in order to grab at the low-hanging fruit, it’s best to start with your network. A few of the solutions below can focus in on a culprit quickly and resolve your problems immediately. So why waste time troubleshooting your own computer before canceling out the external issues as a possibility?

The first and quickest way to check what’s connected to your Internet through your router is the DHCP Client table. Each router is a little different, so you may need to search for which menu the table comes under. For Linksys, it’s typically under the “Status” Tab, and then the “Local Network” menu item.

stolen-bandwidth1

Next, just click the “DHCP Client Table” button, and that’ll take you to a list of all clients that are currently logged into your network. Are there any there that you don’t recognize? If so, there could potentially be a neighbor that’s drawing out much of your bandwidth.

stolen-bandwidth2

Ads by Google

All you have to do to put an end to it is click on the “Delete” button to the right of that client. Just be careful not to inadvertently delete one of your own clients, because to reconnect to the network with that device, you may need to re-enter your security password again. Not a big deal, just a hassle.

Use Third Party Utilities To Unravel Bandwidth Problems

Another option is to turn to software tools that can reach out and monitor devices on your network. One of those utilities is a free app called Capsa, which Matt actually mentioned in his Guide to Home Networking.

Capsa is really impressive, and it’s hard to believe that it’s free software. Running Capsa, you can see traffic on your network and associated data transfer rates to and from the various hosts, which you can find under the “Protocol” tab once you press “Start” on the main welcome screen.

stolen-bandwidth3

This is even better organized on the IP Endpoint tab, which lines up all of the hosts in one area and then in the lower pane, shows you all of the remote IP connections of the host you selected in the top pane. By the way, this is a great way to check out what your kids are up to on your network without actually installing monitoring software on their computer.

stolen-bandwidth4

Capsa is by far my favorite. This is similar to using another bandwidth monitoring app I covered recently called NetworkMiner, except that Capsa is less about network hacking and packet sniffing, and more about monitoring your network for activities and different traffic protocols. Either application would serve you well, though.

View more: http://www.makeuseof.com/tag/find-out-whos-eating-your-bandwidth-with-these-tips/

分类: Tips & How-tos 标签:

HOW TO CAPTURE PACKETS ON YOUR CISCO ROUTER WITH EMBEDDED PACKET CAPTURE – CONFIGURATION, TROUBLESHOOTING & DATA EXPORT

2015年5月29日 没有评论

If you’re tired of setting up SPAN sessions to capture network traffic transiting your network and Cisco router, it’s time to start usingCisco’s Embedded Packet Capture (EPC), available from IOS 12.4.20T and above. We will show you how to configure Cisco’s Embedded Packet Capture, to capture packets transiting a Cisco router, save them to its flash disk or export them directly to anftp/tftp server for further analysis with the help of a packet analyzer such as Colasoft Capsa or Wireshark.

We’ve selected to Colasoft Capsa as our packet analyzer because of its amazing breakdown and presentation of captured packets.

Finally, we’ve also included a number of useful Embedded Packet Capture troubleshooting commands to monitor the status of thecapture points and memory buffer.

Let’s take a look at some of the basic features offered by Embedded Packet Capture:

  • Capture IPv4 and IPv6 packets in the Cisco Express Forwarding path
  • Ability to specify various capture buffer parameters
  • Export packet captures in PCAP format, enabling analysis with external tools such as Colasoft Capsa, Wireshark.
  • Display content of the capture buffer
  • Granularity of captured packets via Standard or Extended Access Control Lists (ACLs)


cisco-router-embedded-packet-capture-1Figure 1. Understanding Basic Embedded Packet Capture Terminology

Before we dive into the configuration of Cisco EPC, let’s explain the two terms used during the EPC configuration:  Capture Buffer &Capture Point.  We’ll use figure 1 to help illustrate the terms.

CAPTURE BUFFER

Capture buffer is an area in memory for holding packet data.  There are two types of Capture Buffers: Linear and Circular.

Linear Capture Buffer: When the capture buffer is full, it stops capturing data.
Circular Capture Buffer: When the capture buffer is full, it continues capturing data by overwriting older data.

CAPTURE POINT

Capture point is a traffic transit point where a packet is captured. Capture points need to define the following:

  • IPv4 or IPv6
  • CEF (Cisco Express Forwarding or Process-Switched
  • Interface e.g Fast Ethernet0, Dialer0 etc.
  • Direction of traffic to the interface: in (ingress), out (engress) or both


CONFIGURING CISCO EMBEDDED PACKET CAPTURE

EPC configuration is an easy 5 step configuration process. Examining the diagram below, our goal is to capture ingress & egress packets on interface FastEthernet0 from workstation 192.168.3.2 to and from Firewall.cx:
cisco-router-embedded-packet-capture-2Figure 2. Capturing packets betwen host 192.168.3.2 and Firewall.cx

Note: None of the below configuration commands, except the optional access lists (filters), will be stored in the router’s running-configuration or startup-configuration. ‘Monitor’ commands are only stored in the router’s RAM and are lost after a router reboot.

STEP 1 –   DEFINE A CAPTURE BUFFER

The capture buffer will store the packets to be captured. Our capture buffer will be named firewallcx_cap and will have size of 1024KB (1 Mb), which is the default size and will be set to linear type buffer:

R1# monitor capture buffer firewallcx_cap size 1024 linear

STEP 2 – DEFINE THE TRAFFIC TO BE CAPTURED (OPTIONAL)

We can optionally configure to capture specific traffic. In our case, we need to capture traffic between hosts 192.168.3.2 and 208.86.155.203 (Firewall.cx).  This is accomplished with the use of access control lists. We can make use of standard or extended access lists depending on the granularity required. If no access list is configured, all traffic will be captured.

R1(config)# ip access-list extended selected-traffic 
R1(config-ext-nacl)# permit ip host 192.168.3.2 host 208.86.155.203
R1(config-ext-nacl)# permit ip host 208.86.155.203 host 192.168.3.2
R1(config-ext-nacl)# end
R1# monitor capture buffer firewallcx_cap filter access-list selected-traffic

Filter Association succeeded

Note: Our access list includes traffic originating from both hosts because we want to capture bidirectional traffic.  If we included only one ACL statement, then only one-way traffic would be captured.

Our filter is now in place and we are ready for the next step.


STEP 3 – DEFINE CAPTURE POINT AND PARAMETERS

Here we define which interface will be the capture point. In our case, this is Fast Ethernet0 and we’ll capture both ingress and egress packets. During this configuration phase, we need to provide a name for the capture point, we selected CPpoint-FE0 to make it easy to distinguish.

Note: It is highly advisable to ensure ip cef is enabled to ensure minimum impact on the router’s CPU. If ip cef is not enabled, a message like the one below will appear, in which case you need to enable ip cef and re-enter the command.

R1# monitor capture point ip cef CPoint-FE0 FastEthernet 0 both
IPv4 CEF is not enabled

R1# config t
Enter configuration commands, one per line.  End with CNTL/Z.
R1(config)# ip cef
R1(config)# exit
R1# monitor capture point ip cef CPoint-FE0 FastEthernet 0 both
*May 25 14:54:40.383: %BUFCAP-6-CREATE: Capture Point CPoint-FE0 created.

STEP 4 – ASSOCIATE THE CAPTURE POINT WITH THE CAPTURE BUFFER

Here we associate the configured capture point with the capture buffer:

R1# monitor capture point associate CPoint-FE0 firewallcx_cap

At this point, we are ready to start capturing packets!


STEP 5 – START, STOP CAPTURING PACKETS

It’s now time to start capturing those packets using the monitor capture point start command:

R1# monitor capture point start CPoint-FE0

*May 25 14:57:02.091: %BUFCAP-6-ENABLE: Capture Point CPoint-FE0 enabled.

At this point, the router is capturing all traffic between our two hosts.

To stop the capturing process, use the monitor capture point stop command:

R1# monitor capture point stop CPoint-FE0

*May 25 15:00:51.419: %BUFCAP-6-DISABLE: Capture Point CPoint-FE0 disabled.


USEFUL VERIFICATION COMMANDS

1. To monitor the status of our buffer, we can use the show monitor capture buffer command:

R1# show monitor capture buffer all parameters
Capture buffer firewallcx_cap (linear buffer)
Buffer Size : 1048576 bytes, Max Element Size : 68 bytes, Packets : 263
Allow-nth-pak : 0, Duration : 0 (seconds), Max packets : 0, pps : 0
Associated Capture Points:
Name : CPoint-FE0, Status : Active
Configuration:
monitor capture buffer firewallcx_cap size 1024 linear
monitor capture point associate CPoint-FE0 firewallcx_cap
monitor capture buffer firewallcx_cap filter access-list selected-traffic
R1#


2. To view Capture Point details, use the show monitor capture point all command:

R1# show monitor capture point all
Status Information for Capture Point CPoint-FE0
IPv4 CEF
Switch Path: IPv4 CEF            , Capture Buffer: firewallcx_cap
Status : Active

Configuration:
monitor capture point ip cef CPoint-FE0 FastEthernet0 both

 
3. To see all information about the captured packets, use the ‘show monitor capture buffer’ command:

R1# show monitor capture buffer firewallcx_cap
15:04:50.835 UTC May 25 2015 : IPv4 LES CEF    : Fa0 None
15:04:51.015 UTC May 25 2015 : IPv4 LES CEF    : Fa1 Fa0
15:04:51.015 UTC May 25 2015 : IPv4 LES CEF    : Fa0 None
15:04:51.195 UTC May 25 2015 : IPv4 LES CEF    : Fa1 Fa0
15:04:51.443 UTC May 25 2015 : IPv4 LES CEF    : Fa1 Fa0


4. To examine the buffer’s contents, use the ‘show monitor capture buffer dump’ command:

R1# show monitor capture buffer firewallcx_cap dump
15:04:50.835 UTC May 25 2015 : IPv4 LES CEF    : Fa0 None86621680: 5475D061 2856F4CE 469A161C      TuPa(VtNF…
86621690: 08004500 00347440 40007F06 57B7C0A8  ..E..4t@@…W7@(
866216A0: 0302D056 9BCBC6BC 00506100 C18E0000  ..PV.KF<.Pa.A…
866216B0: 00008002 20003676 00000204 04EC0103  …. .6v…..l..
866216C0: 03020101 040200                      …….

15:04:51.015 UTC May 25 2015 : IPv4 LES CEF    : Fa1 Fa0

86621680: F4CE469A 161C5475 D0612856      tNF…TuPa(V
86621690: 08004500 00340000 40003406 16F8D056  ..E..4..w.4..xPV
866216A0: 9BCBC0A8 03020050 C6BC8F58 11D26100  .K@(…PF<.X.Ra.
866216B0: C18F8012 39087B6D 00000204 05AC0101  A…9.{m…..,..
866216C0: 04020103 030700                      …….

15:04:51.015 UTC May 25 2015 : IPv4 LES CEF    : Fa0 None

86621680: 5475D061 2856F4CE 469A161C      TuPa(VtNF…
86621690: 08004500 00287443 40007F06 57C0C0A8  ..E..(tC@…W@@(
866216A0: 0302D056 9BCBC6BC 00506100 C18F8F58  ..PV.KF<.Pa.A..X
866216B0: 11D35010 4137B408 00000000 00000000  .SP.A74………
866216C0: 04


EXPORT CAPTURED DATA

In most cases, the data captured will need to be exported to a network analyzer for additional analysis within a user friendly interface.

Note: Captured buffer can be exported to a number of locations including: flash: (on router), ftp, tftp, http, https, scp (secure copy) and more.

Export the captured buffer using the monitor capture buffer export command. Keep in mind that we must stop the capturing process before exporting the data, and also have our tftp server ready to accept the captured data:

R1# monitor capture point stop CPoint-FE0
R1#
*May 25 15:35:31.975: %BUFCAP-6-DISABLE: Capture Point CPoint-FE0 disabled.
R1#
R1# monitor capture buffer firewallcx_cap export tftp://192.168.5.53/capture.pcap
!!!!!!!
R1#

At this point, the capture.pcap file should be located on our workstation.

We are now ready to import the data into our network analyzer Capsa for further analysis:

cisco-router-embedded-packet-capture-3Figure 3. Importing packets into Colasoft Network Analyzer

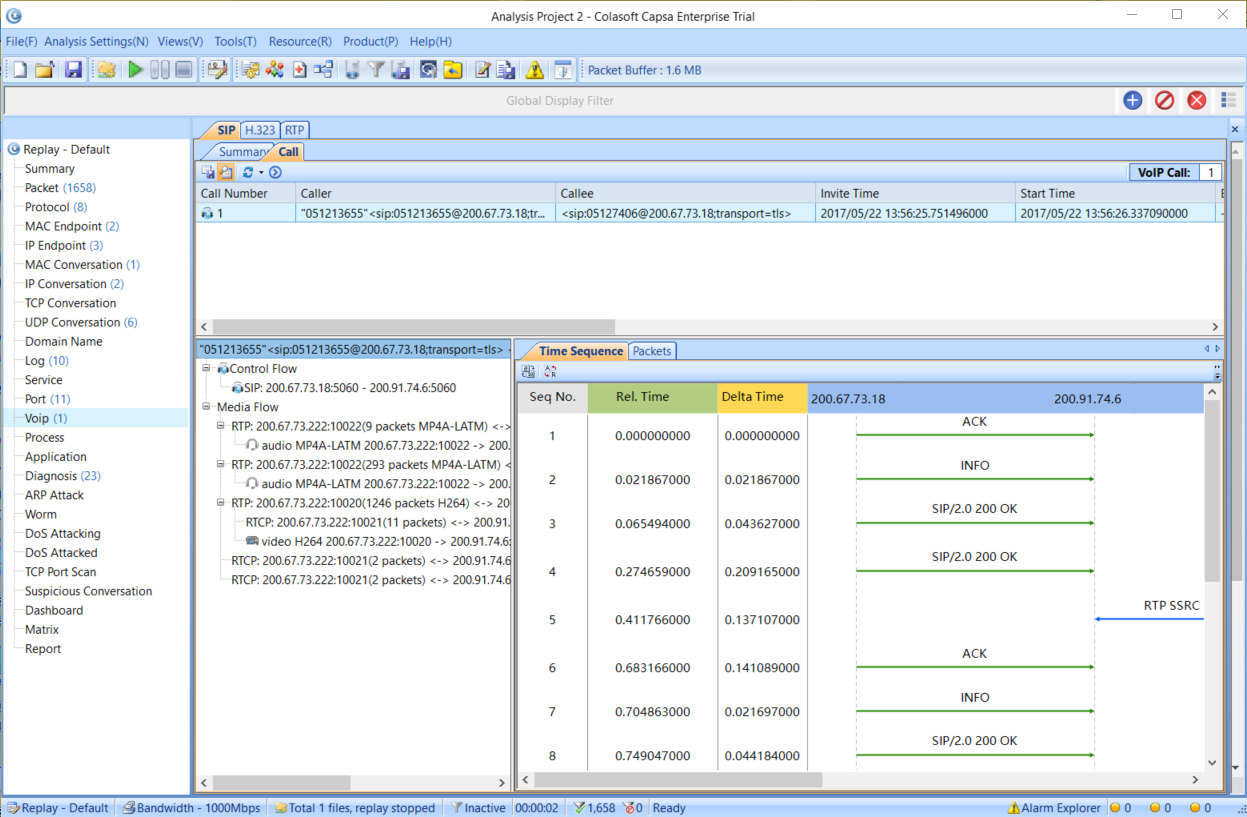
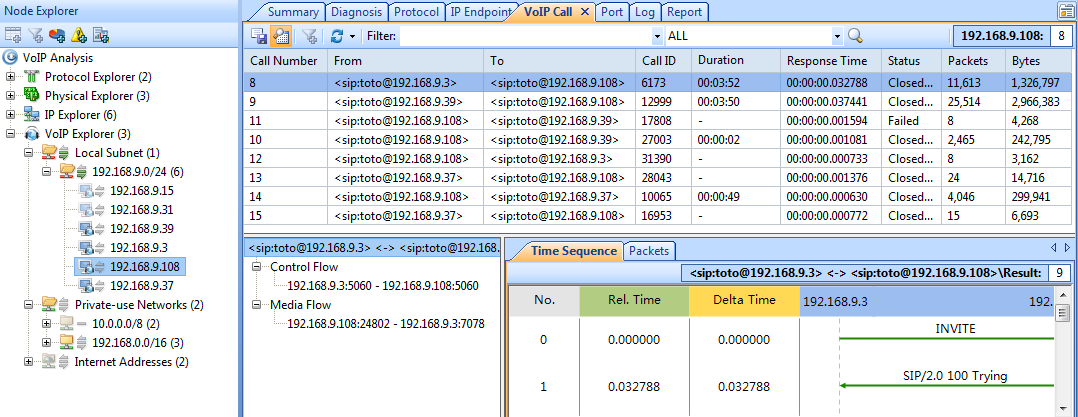
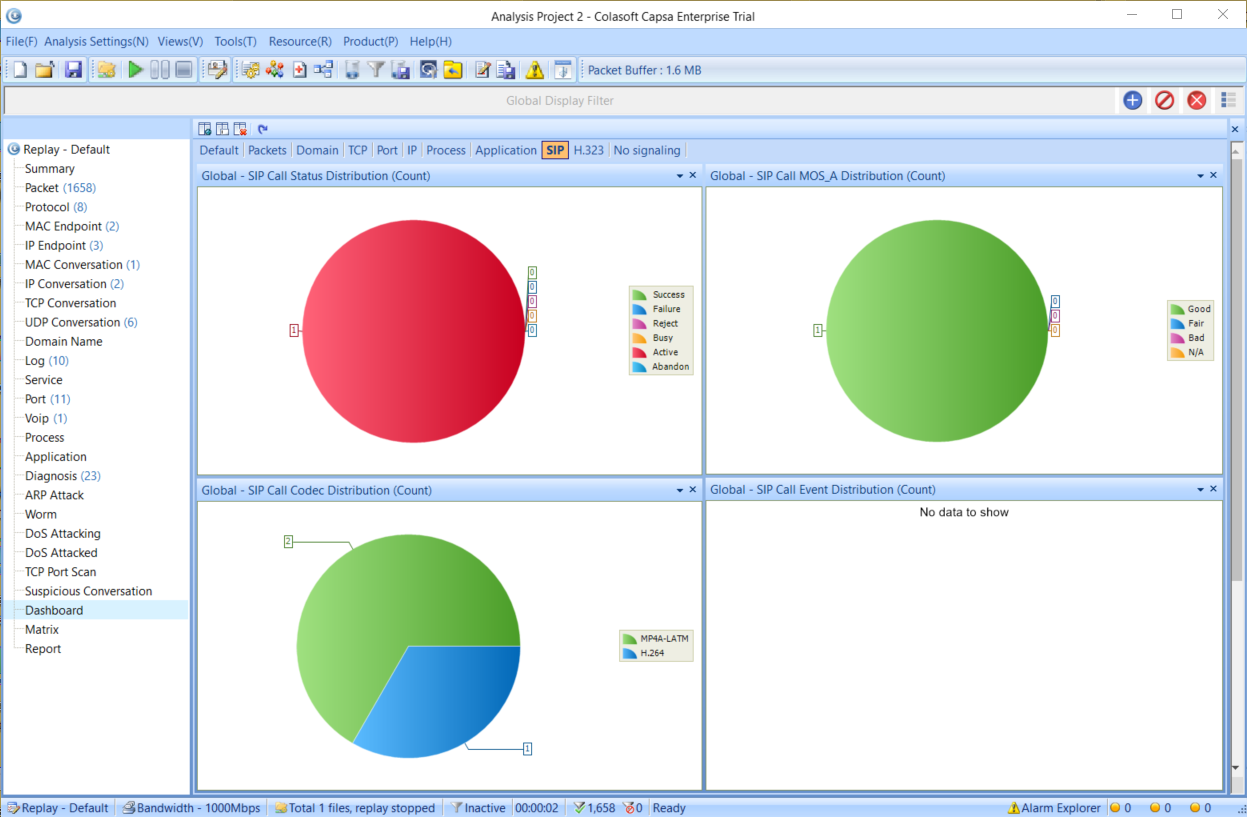
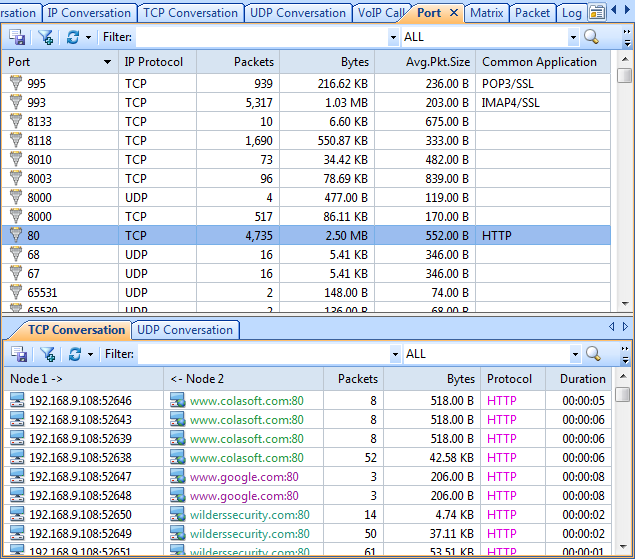
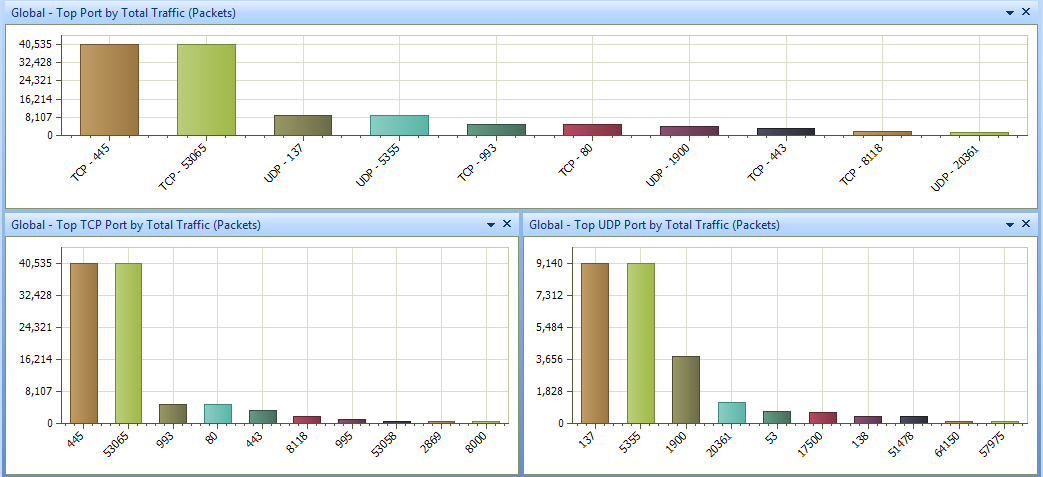
Once the import process is complete, our captured packets are displayed and we can analyse them in a more user-friendly environment:

cisco-router-embedded-packet-capture-4
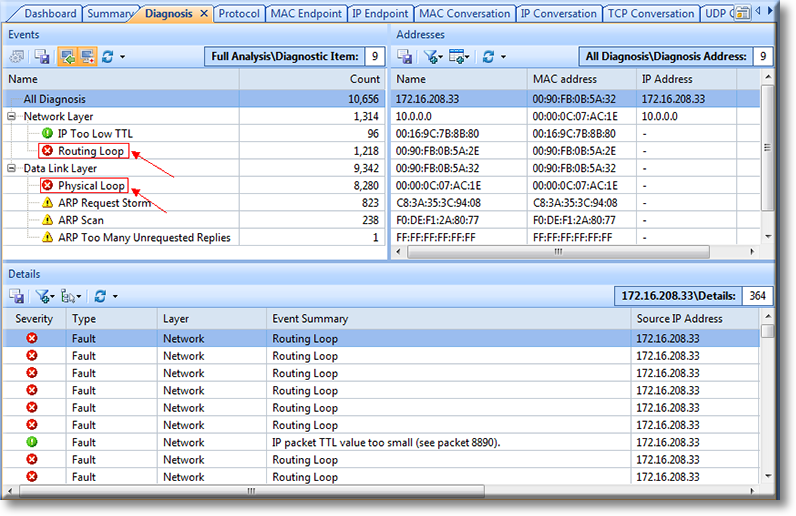
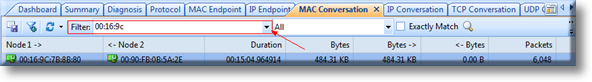
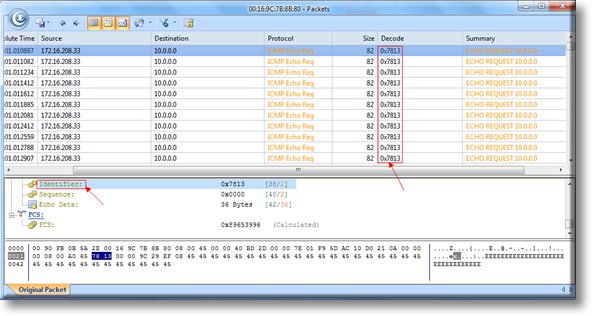
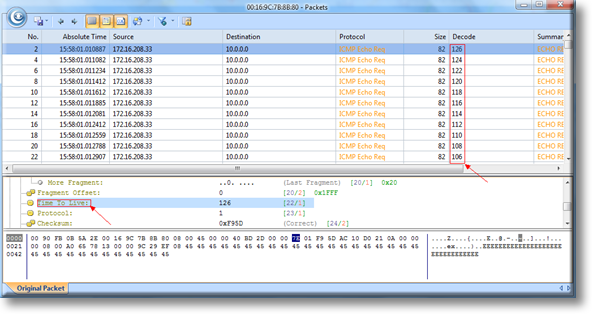
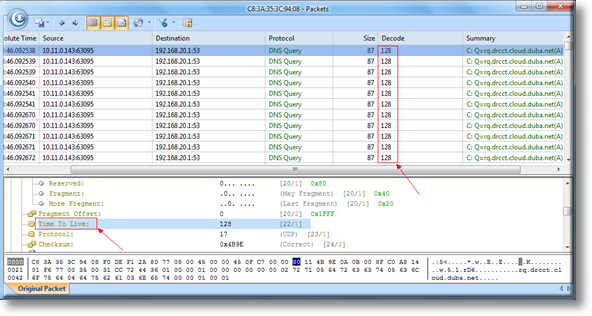
Figure 4. Packets displayed inside Colasoft Capsa network analyzer


This article introduced the Cisco Embedded Packet Capture feature offered on all Cisco router IOS platforms from version 12.4.20T and above. We explained terms used by the Embedded Packet Capture feature (Capture Buffer, Capture Point) and showed how toconfigured Embedded Packet Capture using 5 simple steps, but also how to export captured data from the Cisco router so that it can be imported into a network analyzer.

from: http://www.firewall.cx/cisco-technical-knowledgebase/cisco-routers/1089-cisco-router-embedded-packet-capture-configuration-usage-troubleshooting-exporting.html

分类: Tips & How-tos 标签:

THE IMPORTANCE OF A NETWORK ANALYZER – PACKET SNIFFER. MUST-HAVE FEATURES FOR DEMANDING ENGINEERS & ADMINISTRATORS

2015年4月22日 1 条评论

Network Analyzers, also known as Packet Sniffers, are amongst the most popular network tools found inside any Network Engineer’s toolkit. A Network Analyzer allows users to capture network packets as they flow within the enterprise network or Internet.

Engineers usually make use of Network Analyzers to help uncover, diagnose andfix network problems, but they are also used by hackers to obtain access tosensitive information and user data.


FEATURES OFFERED IN HIGH-QUALITY NETWORK ANALYZERS

When dealing with network problems, engineers usually follow standard tests to try to identify the source of the problem and make any necessary corrections. These tests usually involve checking the source (Client or Network device) IP address, Gateway, DNS server, Nslookup and performing a few ICMP Echo Requests (aka Ping) to verify connectivity with the local network and destination IP.

These methods are usually enough to diagnose simple problems, but are clearly inadequate when dealing with complex network problems. This is where a high-quality network analyzer comes into play.

Any typical network analyzer will capture and display packets, providing basic packet information such as time of capture, source & destination MAC address, source & destination IP address, Layer 4 protocol information (TCP/UDP flags, ports, sequence/acknowledgement numbers) and the data payload. While this information is extremely useful information, it often means that additional time is required by the engineer to locate the data stream/conversation of interest and track down all associated packets.

Further analysis of the captured data usually increases the difficulty and expertise level required to make sense of the information captured.

Let’s take a look at the most important features high-end network analyzers have, that helps simplify complex troubleshooting in our everyday routine.

Download your copy of Capsa Enterprise Network Analyzer now!

REAL-TIME NETWORK CARD UTILIZATION

Real-time network card utilization is a very handy ‘visual tool’ as it shows the bandwidth utilization of the network card used to capture packets.

When configuring SPAN on Cisco Catalyst switches to monitor a switchport that connects to a router or server, the real-time visual representation of network traffic has proven to be extremely useful as it’s much easier spot packet bursts and other traffic patterns.

important-network-analyzer-packet-sniffer-features-1

Figure 1. Capsa Enterprise real-time network utilization

CONFIGURABLE BUFFER SIZE

All traffic captured by the network analyzer is stored in a special buffer. This buffer usually resides in the workstation’s RAM and can be saved on the hard disk, so that additional analysis can be performed later. While most packet analyzers allow the buffer size to changed, its size is usually restricted to a few MB.

The ability to use an extremely large capture buffer e.g 1024MB or 1 Gigabyte, is necessary when performing analysis of heavy traffic where a couple of hundreds of MBs are typically required.


IP CONVERSATION TRACKING & TRANSACTION SEQUENCE DIAGRAMS

A high-quality network analyzer smartly presents all captured information in an easy-to-understand manner, making it easy and fast to locate any IP Conversation between hosts:

important-network-analyzer-packet-sniffer-features-2

Figure 2. Capsa Enterprise displays IP Conversations between our workstation and Firewall.cx

Having the ability to drill-down into each IP Conversation is equally important. Colasoft Capsa provides this important feature by simply double-clicking on any of the displayed conversations:

important-network-analyzer-packet-sniffer-features-3

Figure 3. Capsa Enterprise allows us to drill-into each IP Conversation

The Transaction Sequence Diagram section on the left side displays the flow of packets of the displayed IP Conversation. Tracking TCP sequence numbers and TCP acknowledgements is often a very time-consuming process but tools such as Capsa Enterprise makes it easy and allows engineers to focus on the more important information.


AUTOMATIC DIAGNOSTIC TOOLS

Network engineers often need to deal with network problems that occur either from user configuration errors (e.g invalid Domain, incorrect URL etc) or other problems that are often difficult to identify.

Considering the fact your network analyzer captures all traffic, it should be able to automatically identify network/session problems anderrors. This helpful feature helps dramatically when dealing with various network issues as it provides an overall view of problems that have been identified.

In many cases, these errors can lead to uncovering suspicious user activity or hacking attempts:

important-network-analyzer-packet-sniffer-features-4
Figure 4. Capsa Enterprise automatically identifies problems that would otherwise be missed

As shown in the screenshot above, our network analyzer has identified 36 events that can be examined by double-clicking on the specific event in the left window and then selecting the associated addresses from the right window. Packets are then displayed at the bottom area. Double-clicking on these packets will open them for further examination.


TOP NETWORK TALKERS

During times of excessive traffic, it is usually required to identify the network’s top talkers and take action. When supported by the network analyzer, it makes life very easy. When not supported, a sample of network traffic must be taken and sorted by the IP address with the greatest amount of data transferred.

important-network-analyzer-packet-sniffer-features-5

Figure 5. Capsa Enterprise provides the network’s top talkers and their traffic

Capsa provides 4 reports of Top Talkers: Top100 IPv4 Nodes (shown above), Top100 IPv4 Conversations (IP Based), Top100 Physical Nodes (MAC Based) and Top100 Physical Conversations (MAC Based).

Top IP’s can also be obtained via Capsa’s Dashboard (shown below) which provides Global Utilization (% of total interface bandwidth) and Traffic (bytes) within a specific timeframe, Top IPs based on bytes transferred, and Top Application Protocols based on the protocol used:

important-network-analyzer-packet-sniffer-features-6
Figure 6. Capsa’s Dashboard provides a healthy amount of real-time information and traffic captured

ADVANCED FILTERING

Filtering is a core feature that allows network engineers to select specific type of traffic based on its characteristics. Common filtering found on most network analyzers includes: Source/Destination MAC or IP address, Protocol and Port numbers.

Advanced filtering is a feature most engineers require in their network analyzer, but often don’t have. Advanced filtering allows special complex filters to be created based on additional characteristics such as Time, Packet size, Data Payload values in conjunction with AND/OR/NOT logical operations.

important-network-analyzer-packet-sniffer-features-7

Figure 7. Capsa’s Advanced Filtering leaves nothing to be desired

CONCLUSION

A high-quality network analyzer bundled with useful advanced features as the above will help any engineer or administrator diagnoseand deal with network problems quickly and efficiently, but also capture suspicious network traffic patterns often associated withhacking attempts. When selecting your network tools, ensure they are of the highest quality and provide features that will help make your job easier.

from: http://www.firewall.cx/networking-topics/general-networking/1084-important-network-analyzer-packet-sniffer-features.html


分类: Articles, Reviews, Tips & How-tos 标签:

Migrating Configuration Files from nChronos Evaluation to an nChronos Licensed Version

2014年11月7日 没有评论

Migrating configuration files on the same machine

The following steps will allow you to migrate configuration files from an nChronos Evaluation to an nChronos Licensed version on the same machine.

  1. When uninstalling nChronos Evaluation program please click “Yes” when following box pops up:
  2. Install the nChronos Licensed version. By clicking this uninstall “Save” action all configurations and captured data files will be saved automatically.

Migrating configuration files to a different machine

Follow the following steps if you installed the nChronos Evaluation version on one machine and now want to migrate the files to an nChronos Licensed version on a different machine,

  1. Export the configurations from nChronos Evaluation. Login to the nChronos Server web portal then go to the Server Management page and click Export Config button to save the configurations:
  2. Install and activate the new licensed version of nChronos. Login to the nChronos Server web portal, go to the Server Management page, and click the Import Config button to import the saved file in step 1.
  3. After the import is complete the nChronos service will automatically restart. After the restart, the configuration files will now be migrated.

Download Capsa

What’ s new in Capsa 7.8

2014年8月28日 没有评论

What’ s new in Capsa 7.8

 VoIP Analysis

Capsa 7.8 provides a VoIP analysis module to capture and analyze VoIP calls and graphically display VoIP analysis results, which helps IT staff baseline and troubleshoot VoIP-based networks.

A VoIP view is provided to list all VoIP calls as well as their related statistics and has a lower pane for analyzing voice and video control flows and media flows as well as their jitter, loss, MOS, etc., to visualize analysis data and assess voice and video quality.

Download Capsa

A VoIP Explorer groups private and public IP addresses for VoIP calls.

Furthermore, there are VoIP diagnosis events and VoIP logs. A VoIP dashboard contains the VoIP analysis charts graphically.

Together with VoIP Explorer and VoIP diagnosis, the VoIP view helps users visualize analysis data and assess voice and video quality, to thereby assist you troubleshooting VoIP networks, software and hardware.

Top Domain Name Statistics

Earlier versions of Capsa provide a Name Table feature to help network administrators conveniently manage staff’s network activities by displaying the IP address as names instead of figures. Capsa 7.8 here now provides a top domain feature which shows top visited Internet IP addresses as domain names. We know that one domain name may be resolved to be multiple IP addresses, and Capsa can identify all these IP addresses as one domain name if they are actually directed to that domain, and graphically display the top resolved domain names:

Port – Based Statistics

A Port view is provided to present traffic statistics based on TCP/UDP port numbers. This feature is useful when you want to analyze a specific application. The port numbers are provided with above layer protocol, packets, bytes, average packet size, and common application.

In addition, the Dashboard view provides a Port panel to graphically display top port statistics:

Learn more