存档

文章标签 ‘Colasoft’

Colasoft Capsa Network Analyzer v8.3 is Available Now!

2016年3月29日 没有评论

We are very pleased today to announce that a new version of Colasoft Capsa Network Analyzer, a real-time portable network analyzer for wired and wireless network monitoring, bandwidth analysis, and intrusion detection, is now available.

Capsa Network Analyzer v8.3 comes with the following improvements and fixed bugs:

  • The Windows 10 operating system logs off from time to time when starting Capsa.
  • Added name table cannot be auto-saved.
  • Packet files with capitalized extension cannot be replayed.
  • Log View settings in Analysis Profile cannot be auto-saved.
  • For wireless analysis, no packets are shown on the Packet view when a MAC address is selected in the Node Explorer.

A free trial of Capsa network analyzer v8.3 is available for download at:http://www.colasoft.com/download/products/download_capsa.php

Case Study: Credit Union of Denver

2016年1月13日 没有评论
  Colasoft’s products offer several tools to help us identify devices and traffic anomalies on our network. They also offer the Wi-Fi application to assist in further network issues or privacy concerns. Colasoft’s Capsa is affordable and efficient!”

– Benjamin Shumaker, NISO, Credit Union of Denver

Company Brief

As one of Colorado’s oldest and largest member-owned financial cooperatives, Credit Union of Denver provides its members with more overall value in the form of excellent rates, outstanding service, superior products and convenient access. By leveraging over 81 years of experience to keep operating costs low, membership returns high, and by making member satisfaction a top priority, Credit Union of Denver makes achieving financial goals smarter and more rewarding than ever before.

The Challenge

As a credit union, Credit Union of Denver needs quick identification of potential problems. They use multiple PC based applications as well as 3rd party browser based interfaces that require secure, fast, smooth delivery results. Changes to their environment can lead to negative impact on performance of network related information. Therefore, trying to identify the offending application or network breakdown is an urgent challenge of Credit Union of Denver.

The Solution

Comparing with some network analyzer they used before, Credit Union of Denver would like to choose a network analyzer which is easy to understand and adapt. The user-friendly interface of Capsa is what they want.

In the fast-paced financial industry, everything needs a quick result. By using Capsa, Credit Union of Denver is able to immediately identify applications which are inefficient and causing lots of unnecessary network traffic. Colasoft’s Capsa helps the company identify performance issues on network and save time at pin pointing the applications or networks causing the problem.

Voice

“The look and feel was great. Ability to capture packets, inspect, and diagnose were impressive. The overall Mapping ability to see where all the traffic is flowing, most popular hits, or congestive areas were visible.”

“The product was so easy that we did not require any support.”

Contact Info

Address: 9305 W. Alameda Ave Lakewood, Colorado 80226
Phone: 303-234-1700
Email: Secadmins@cudenver.com
Website: www.cudenver.com

View More

Capsa network analyzer review

2015年10月12日 没有评论
Capsa.png

Capsa network analyzer review from wireshark.com.

Capsa is a powerful network analyzer for Ethernet analysis, troubleshooting and monitoring. Not only does it provide users with a series of powerful features that help them learn more about improving network security, pinpoint network issues and monitor network activities, but it also features a user-friendly interface that makes using it a breeze. The software is generally targeted at computer professionals and/or teachers who want to learn more about networking technology, protocols, monitoring and security.


Real time monitoring

As a packet sniffer, Capsa is capable of real time packets monitoring and can also presents the data visually by using logs and a GUI for future reference. Given the fact the software is capable if easily analyzing and diagnosing problems on a network, it can tell the user in minutes what is causing it to be slow or if there is an attack that may be the culprit for its poor performance.

In identifying network issues, Capsa can find the top ten local hosts that slow down the network and can also detect whether someone is using a Bit torrent client to download files off the web which is obviously a prime cause of slow network performance.

Safety and security

Should an attack be responsible for the network’s poor performance, the software will immediately locate the packet info and source codes from the host so that the admin can promptly begin investigating the issue. There are 2 types of worms the software can locate, including operating system works and E-mail worms. This functionality is paramount in identifying the infected computers which eventually allows the admin to fix these issues.

Available filters

In order to be able to focus on specific packets, administrators can use a wide range of filters right from Capsa’s dashboard. For instance, admins can monitor real time messages, http requests, E-mail messages and more of the 4 most popular IM apps including YM, ICQ, AIM and MSN.

Other features

There are of course many other features that Capsa incorporates, such as the ability to generate reports of a certain group or global networks automatically, but also customize the data on different charts. As a network administrator, you can also use the software to remotely monitor traffic by installing the application on the business network (on a workstation of course) and using the Remote Desktop Access function.

Conclusion

All in all, Capsa is by far one of the most reliable and simply the best network analyzers out there. Not only does it offer a wide range of improvements that make using it a breeze, but it makes it very easy for anyone who uses it to find the info they need. On top of that, thanks to functions such as reports, Matrix and Diagnosis, it definitely stands out from the large crowd of similar programs available today.

Source

How to Use Multi-Segment Analysis to Troubleshoot Network Delay and Packet Loss

2015年10月8日 没有评论

Troubleshooting network problems can be a very intensive and challenging process. Intermittent network problems are even more difficult to troubleshoot as the problem occurs at random timeswith a random duration, making it very hard to capture the necessary information, perform troubleshooting, identify and resolve the network problem.

While Network Analyzers help reveal problems in a network data flow, they are limited to examining usually only one network link at a time, thus seriously limiting the ability to examine multiple network segments continuously.

Colasoft’s nChronos is equipped with a neat feature called multi-segment analysis, providing an easy way for IT network engineers and administrators to compare the performance between different links. IT network engineers can improve network performance by enhancing the capacity of the link according to the comparison.

Let’s take a look how we can use Colasoft nChronos’s multi-segment analysis feature to help us detect and deal effectively with our network problems.

Multi-segment analysis provides concurrent analysis for conversations across different links, from which we can extract valuable information on packet loss, network delay, data retransmission and more.

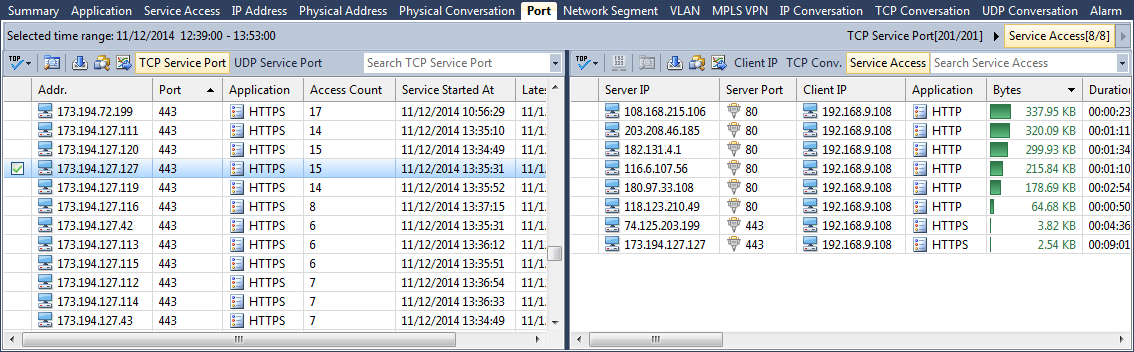
To being, we open nChronos Console and select a portion of the trend chart in the Link Analysis window, then from the Summary window below, we right-click one conversation under the IP Conversation or TCP Conversation tab. From the pop-up menu, selectMulti-Segment Analysis to open the Multi-Segment Analysis window:

Figure 1. Launching Multi-Segment Analysis in nChronos

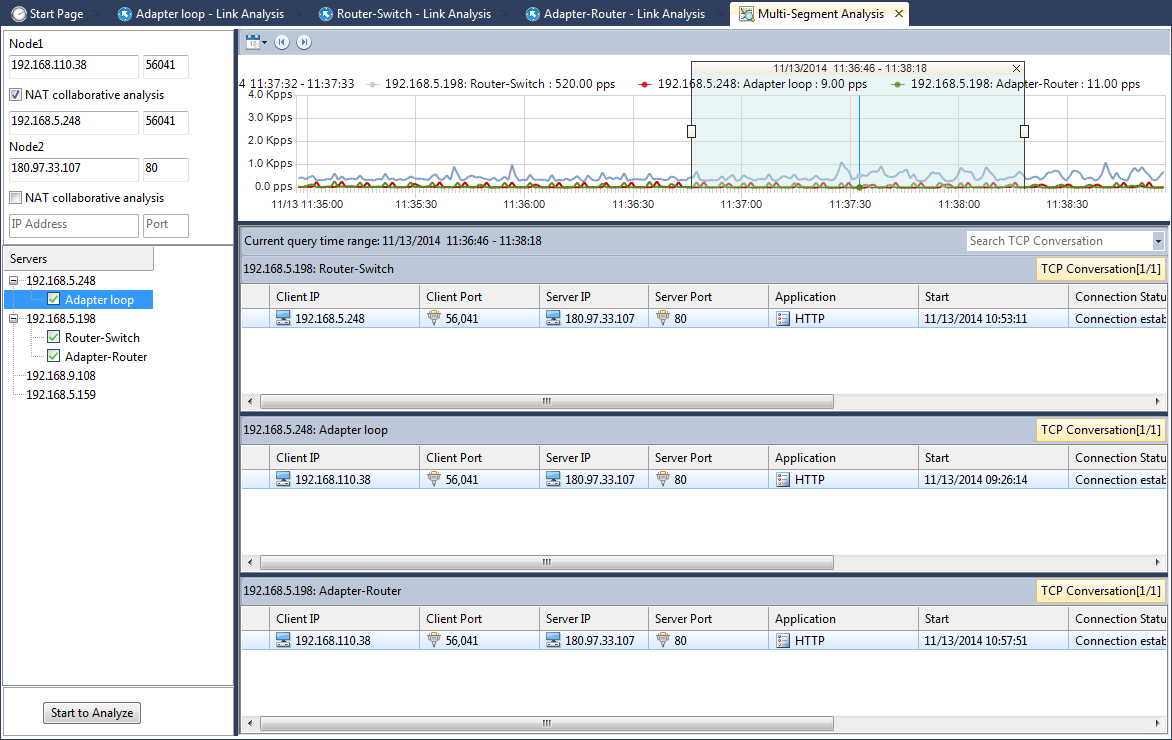
In the Multi-Segment Analysis window, select a minimum of two and maximum of three links, then choose the stream of interest for multi-segment analysis:

Figure 2. Selecting a stream for multi-segment analysis in nChronos

When choosing a conversation for multi-segment analysis, if any of the other selected network links has the same conversation, it will be selected and highlighted automatically. In our example, the second selected link does not have the same data from the primary selected conversation and therefore there is no data to display in the lower section of the analysis window.

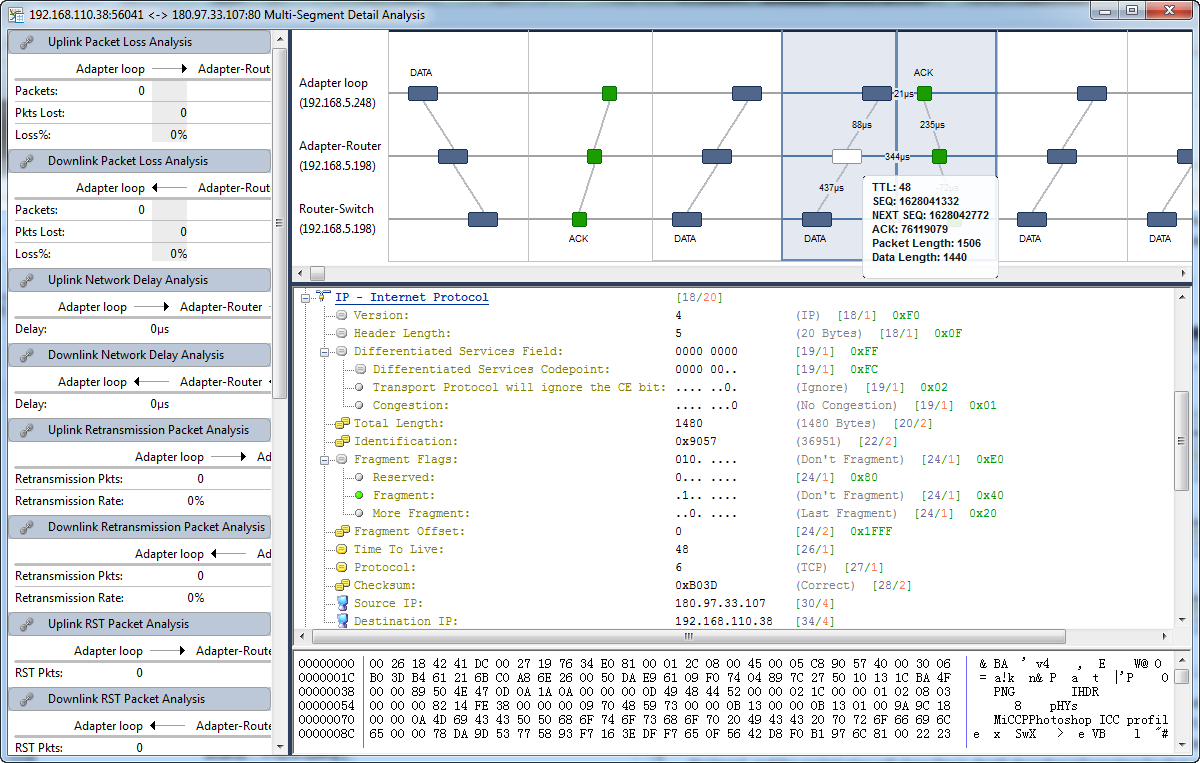
Next, Click Start to Analyze to open the Multi-Segment Detail Analysis window, as shown in the figure below:

Figure 3. Performing Multi-Segment analysis in nChronos

The Multi-Segment Detail Analysis section on the left provides a plethora of parameter statistics (analyzed below), a time sequence chart, and there’s a packet decoding pane on the lower right section of the window.

The left pane provides statistics on uplink and downlink packet loss, uplink and downlink network delay, uplink and downlink retransmission, uplink and downlink TCP flags, and much more.

The time sequence chart located at the top, graphically displays the packet transmission between the network links, with the conversation time displayed on the horizontal axis.

When you click on a packet on the time sequence chart, the packet decoding pane will display the detailed decoding information for that packet.

Using the Multi-Segment Analysis feature, Colasoft’s nChronos allows us to quickly compare the performance between two or morenetwork links. If you’re a network administrator, engineer or IT manager, we strongly suggest you try out nChronos today and see how easy you can discover and deal with network problems.

from: http://www.firewall.cx/general-topics-reviews/colasoft/nchronos-forensic-analysis/1105-network-troubleshooting-multi-segment-analysis-with-nchronos.html


Colasoft Capsa Free is a comprehensive network analyzer

2015年10月8日 没有评论

By Mike Williams

Colasoft Capsa 8 Free is a powerful tool for monitoring and analyzing network traffic, the free version of an enterprise package normally costing from $695.

The program has a vast and lengthy list of features, yet it’s also accessible to regular users. Just choosing an adapter and clicking “Start” gets you an attractive dashboard, with graphs showing network utilization, traffic, and top traffic by protocol and domain (keep in mind that Wi-Fi devices can’t be monitored in the free edition).

That’s just the start. Click the Summary tab and you’ll see the data behind the charts, the total numbers of IP and MAC addresses used in this session, the various protocols, DNS queries and responses, SMTP/ POP3/ IMAP 4 connections and a whole lot more.

Maybe you want to zoom in? Choosing one of the Conversation tabs — TCP, say — allows you to drill down, see which packets went to/from which addresses, the packet size, time sent, and more.

Colasoft Capsa 8 Free captures data packets, too, so you’re not restricted to summaries. Selecting any of these items displays the individual packets, and you can choose one, view any text it contains (maybe the password in a POP3 exchange, say). There’s even a detailed breakdown of the exchange, so for example you might view an IP packet to check its IP flags or TTL value.

This level of analysis isn’t just for a few internet standards, either. The program understands and can decode hundreds of protocols, and show you precisely what’s happening in every exchange.

Unsurprisingly, considering the full Enterprise version costs $995, the free build has a lot of restrictions. No monitoring of Wi-Fi devices, only one network adapter may be monitored, only one capture project can be run at a time, that’s limited to 4 hours maximum, only the first 10 private IP addresses will be analyzed, and so on.

Colasoft Capsa 8 Free has more than enough functionality left to make it interesting, though, for everyone from casual users to network experts. Give it a try.

from: http://betanews.com/2015/07/13/colasoft-capsa-free-is-a-comprehensive-network-analyzer/#comments

What’s New in nChronos 4.3?

2014年11月25日 没有评论

Service Port Monitor

nChronos 4.3 provides a Port view and a Service Access view to monitor and analyze service ports. The Port view calculates the statistics based on IP address + TCP/UDP service port. Together with the sorting function of nChronos, you can easily know which service ports are running on the network, and running for which IPs. The Port view further provides other information about the service port, including the application, the uplink and downlink traffic, the service access time, access times, etc. The Service Access view calculates the statistics based on server and client IPs, port number and applications. It provides the access details for each service port. You can drill a service port down to a specific service access session.

Request a demo

VLAN and VPN Virtual Link Support

nChronos 4.3 provides support for virtual links, including VLAN and MPLS VPN. You can add virtual interfaces and set up network links based on the virtual interfaces. There is a VLAN view, which displays traffic statistics based on VLAN ID. An MPLS VPN view is also provided to display traffic statistics based on MPLS VPN label. Together with the name table function of nChronos, you can add names for VLANs and MPLS VPNs.

Millisecond Analysis

Millisecond analysis provides traffic analysis accurate to one millisecond. It is important for users who care about transient traffic burst. Colasoft nChronos 4.3 provides millisecond traffic statistics and millisecond traffic alarm. Users can define any millisecond traffic alarm according to the need. The Millisecond Analysis window displays the millisecond traffic statistics trend charts in real-time.

Multi-Segment Analysis

Sometimes the responses from large websites are very slow, and to find out the system bottleneck for the websites, it is necessary to analyze each link of the websites. Colasoft nChronos 4.3 provides a multi-segment analysis function, which associates and correlates the data of the same conversation collected on two or more network segments, and displays graphical performance analysis results, like packet loss, delay, retransmission, etc., thus providing visibility into the areas where bottlenecks may occur. A Multi-Segment Analysis window has a timeline pane to show the traffic trends of monitored links. When a conversation is analyzed, the conversations on other segments will be picked up and analyzed automatically.

A Multi-Segment Detail Analysis window shows the detailed analysis results and visualizes the conversation flow across multiple segments. When clicking and hovering a packet, correlated packets will be highlighted, the time difference between the packets will be displayed, and the packet view will show the in-depth decoding information for that packet.

Storage Filter

nChronos 4.3 provides Storage Filter for users to store packets that match the filer rules. You can define the filter rules based on IP/MAC address, port number, protocol type, packet size, etc., and only packets matching the rules will be stored. Besides the filter rules, Storage Filter provides a functionality to truncate the stored packet to a specified size. With Storage Filter, you can store interested packets, and even store only the first few bytes of interested packets. It saves storage space, and helps you avoid from policy problems in some environment.

Request a demo

from: http://www.colasoft.com/nchronos/whatsnew.php

Colasoft Delivers nChronos v4.3 with Multi-Segment Analysis

2014年11月23日 没有评论

Colasoft Delivers nChronos v4.3 with Multi-Segment Analysis

Tulsa, OK – November 19, 2014– Colasoft LLC (www.colasoft.com), an innovative provider of network analysis solutions, today announced a new version of its flagship product, nChronos Forensic Network Analysis Application. The multi-segment analysis leverages the packets recorded by nChronos to make it easier and quicker for network professionals to analyze the root cause of distributed application performance issues.

Most IT managers are have similar difficulty in diagnosing and solving application performance issues. It’s difficult to determine if the fault is in the network, the application, the server, or something else that is unknown. Hours or days are wasted in “finger pointing”. There are many components involved and troubleshooting a multi-segment network is difficult at best. In the past, IT professionals had to capture traffic separately from different points and manually merge the information into a single trace file to determine the root cause. nChronos will now automatically discover which packets and applications were seen at multiple points in the network. nChronos packet data recorder uses advanced algorithms to match data packets across the network. With nChronos v4.3, network problems such as latency, application errors, network anomalies or slow response can be tamed with greater ease and expediency.

nChronos v4.3 provides an even greater user experience with new and useful functionality and improvements. Below are some of the highlights of these new features included in nChronos v4.3:

  1. New views are added including a VLAN View, a MPLS VPN View, a Service Access View and a Port View.
  2. Provides millisecond-level traffic statistics and alarms for network links.
  3. Storage filter is available and packets can be stored with specified length.
  4. Application transaction alarms and application transaction alarm logs are now available.
  5. Packets can be downloaded from multiple network links.
  6. Combination analysis for IPv4 and IPv6 is available.
  7. The packets can now be stamped with switch time.

“We continue to provide an increase in value with additional functionality without sacrificing our easy to use interface. With the addition of multi-segment analysis, as well as the improved Alarm and Reporting function, nChronos now automates the previously tedious process of troubleshooting distributed network issues, with greater efficiency and ease.”, said Brandon Lewis, Director of Customer Support at Colasoft ”.

The evaluation version of nChronos 4.3 is now available on the Colasoft website www.colasoft.com.

From: http://www.colasoft.com/company/news_2014.php

Migrating Configuration Files from nChronos Evaluation to an nChronos Licensed Version

2014年11月7日 没有评论

Migrating configuration files on the same machine

The following steps will allow you to migrate configuration files from an nChronos Evaluation to an nChronos Licensed version on the same machine.

  1. When uninstalling nChronos Evaluation program please click “Yes” when following box pops up:
  2. Install the nChronos Licensed version. By clicking this uninstall “Save” action all configurations and captured data files will be saved automatically.

Migrating configuration files to a different machine

Follow the following steps if you installed the nChronos Evaluation version on one machine and now want to migrate the files to an nChronos Licensed version on a different machine,

  1. Export the configurations from nChronos Evaluation. Login to the nChronos Server web portal then go to the Server Management page and click Export Config button to save the configurations:
  2. Install and activate the new licensed version of nChronos. Login to the nChronos Server web portal, go to the Server Management page, and click the Import Config button to import the saved file in step 1.
  3. After the import is complete the nChronos service will automatically restart. After the restart, the configuration files will now be migrated.

Download Capsa

Colasoft Thanksgiving Big Sale, Saving $1590 !

2014年11月2日 没有评论


In this Thanksgiving season, Colasoft would like to thank you all for your continued support and trust.

We are very proud that nearly half a million users are now using Colasoft products as their network troubleshooting tools.

We would like every one of you to have that same opportunity this November from Colasoft.

Just pick the opportunity that best meets your needs.


What’ s new in Capsa 7.8

2014年8月28日 没有评论

What’ s new in Capsa 7.8

 VoIP Analysis

Capsa 7.8 provides a VoIP analysis module to capture and analyze VoIP calls and graphically display VoIP analysis results, which helps IT staff baseline and troubleshoot VoIP-based networks.

A VoIP view is provided to list all VoIP calls as well as their related statistics and has a lower pane for analyzing voice and video control flows and media flows as well as their jitter, loss, MOS, etc., to visualize analysis data and assess voice and video quality.

Download Capsa

A VoIP Explorer groups private and public IP addresses for VoIP calls.

Furthermore, there are VoIP diagnosis events and VoIP logs. A VoIP dashboard contains the VoIP analysis charts graphically.

Together with VoIP Explorer and VoIP diagnosis, the VoIP view helps users visualize analysis data and assess voice and video quality, to thereby assist you troubleshooting VoIP networks, software and hardware.

Top Domain Name Statistics

Earlier versions of Capsa provide a Name Table feature to help network administrators conveniently manage staff’s network activities by displaying the IP address as names instead of figures. Capsa 7.8 here now provides a top domain feature which shows top visited Internet IP addresses as domain names. We know that one domain name may be resolved to be multiple IP addresses, and Capsa can identify all these IP addresses as one domain name if they are actually directed to that domain, and graphically display the top resolved domain names:

Port – Based Statistics

A Port view is provided to present traffic statistics based on TCP/UDP port numbers. This feature is useful when you want to analyze a specific application. The port numbers are provided with above layer protocol, packets, bytes, average packet size, and common application.

In addition, the Dashboard view provides a Port panel to graphically display top port statistics:

Learn more