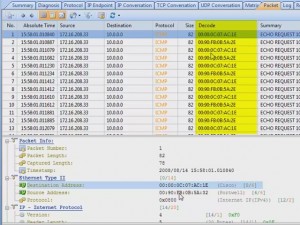
Review: Colasoft Capsa from WindowsITPro.com

2010年6月1日 1 条评论

by Michael Dragone at June 1, 2010.

At some point in the career of almost any IT professional, there comes a time when a detailed examination of network traffic at the packet level is required to troubleshoot a problem. These problems often occur at the worst time, and having the ability to quickly perform a detailed traffic analysis is critical to resolving the problem swiftly and efficiently.

In the field of network analyzers, there’s a range of choices. On the one end, you can obtain free tools that support basic capture tasks but require you to perform much of the analysis. On the other end, you can purchase multifunctional tools that perform the analysis for you.

I took at look at the recently released Capsa 7.1 from Colasoft to see how it performed. I was especially interested to see how it fared against free tools such as Microsoft’s Network Monitor and Wireshark (formerly Ethereal). I ran the software on a Windows XP Professional SP3 computer.

Capsa downloaded quickly, and the installation process was brief. During installation, I was given the opportunity to install additional Colasoft tools such as a packet generator. I declined because I was focusing on the network analyzer, but it was nice to see those tools included as an installation option and not as an additional download. I was also happy that the installation process gave me full control over the creation of the desktop and Quick Launch icons instead of littering my test computer with icons everywhere. Finally, I was expecting to have to reboot my computer after the installation, as I assumed that the installation routine would make changes to the network stack. I was happy to see that this wasn’t the case and no reboot was required.

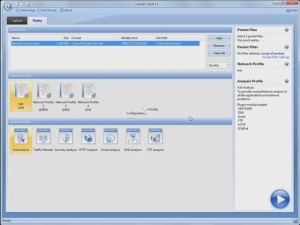
When you start Capsa, an interface presents you with intuitive options that let you select the network you want to analyze and the type of analysis you want to perform, such as Full Analysis, Traffic Monitor, Security Analysis, and Email Analysis. I wanted to analyze traffic, so I selected Traffic Monitor and clicked the large play button. The analysis began immediately.

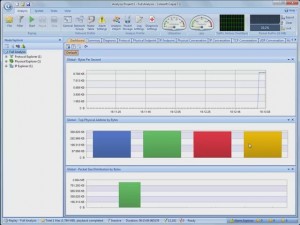
As Figure 1 shows, Capsa uses the Fluent interface introduced in Microsoft Office 2007. As such, it’s extremely easy to navigate and almost, dare I say, fun to poke around the various tabs as the product captures network traffic.
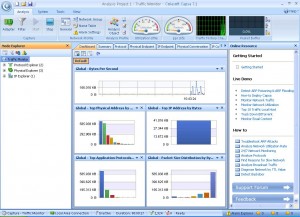
ColaSoft-Capsa-125186-Fig1

The information that the product can capture can be daunting, but it was easy to filter the capture to look for only HTTP traffic. The filter interface provides an excellent graphical representation of what your newly created filter will do.

I was able to drill-down into my newly captured HTTP traffic to the packet level and examine all the details. Because it was encrypted HTTP Secure (HTTPS) traffic, I couldn’t look into the data payload, but all the header details were available. I was also able to examine entire TCP conversations, from the initial handshake all the way down to the FIN flag. The graphical representations that this product can produce are simply wonderful.

Overall, Capsa is a joy to use. My only complaint is the high price tag, which might make it difficult to obtain if you don’t spend a majority of your time examining network traffic, as free (and excellent) alternatives exist. Despite this, I highly recommend this product and would be glad to add it to my toolbox.

Google protects your search terms proved by Capsa network analyzer

2010年5月27日 4 条评论

google_ssl_search

Google announced last week that users can visit https://www.google.com to establish a secure connection for their searches, which Google says “helps protect your search terms and your search results pages from being intercepted by a third party on your network”.

In response to the worries that search terms are eavesdropped by third party on public Internet accesses, especially at public like WIFI hotspots at airport, Google offers a connection over HTTPS to protect your search terms been sniffed. The purpose of this article is to figure out how does the encrypted search connection work and see if it really protects you. As packets never lie, we will go down to the packet level to check the original traffic out. Let Capsa network analyzer to prove that. First let’s check out how the normal search goes.

Normal Google Search

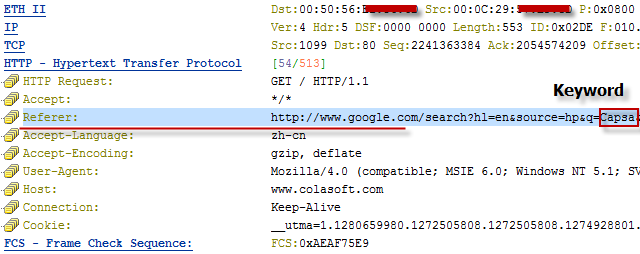
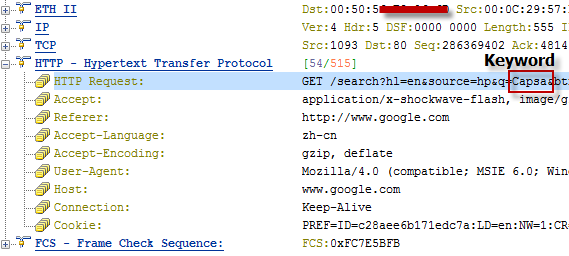
First run Capsa Network Analyzer and start a capture, then visit http://www.google.com, enter the keyword Capsa, and click the Google Search button. Until now, we can clearly see a HTTP packet captured with the keyword “Capsa”. If in a public network, the hacker can easily get the GET request and figure out your search terms with little tricks.

normal_keyword

And another important way to get your search terms is to get the packet of your clicking on a link in the search results, which contains the keywords too. In this case we will click the second link in the results. When we go back to the packets, we can see there are two DNS packets, a DNS query and a response, then three-way-handshake with www.colasoft.com. The fourth packet is a HTTP GET packet.

normal_click_link

If you are interested in this GET packet, you will find a Referer string in it, which is pretty the same as the string in figure below.

normal_referer

Encrypted Google Search

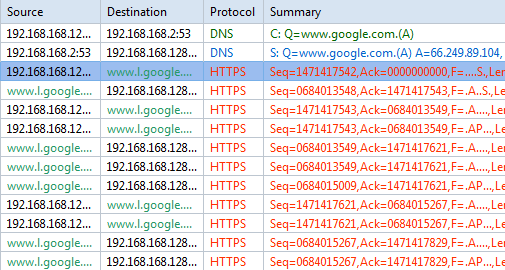
After the normal search, we flush the DNS, start a new capture, and reopen the browser. This time we visit https://www.google.com, enter the same keyword “Capsa”, and click the Google Search button. The page loaded and we go back to the analyzer and find there are DNS packets and HTTPS packets, without any HTTP packets (figure E). As all transmissions are protected by SSL, we cannot find any search keyword in these packets, unless you have that power to decode them.

ssl_packets

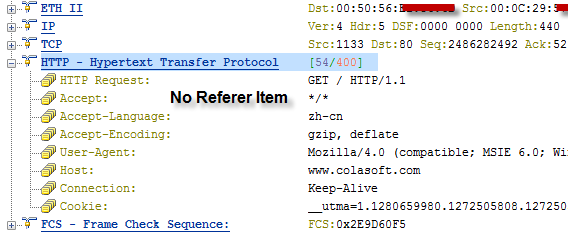
Then we click the same link over the returned search results, and we find there are two DNS packets too and three-way-handshake and then a HTTP GET packet to load the Colasoft page. We can check this packet and find there is not a Referer string (figure F) in it. As google’s explanation, they’ve stopped transferring this value to the clicked page to prevent keywords being tracked.

ssl_click_link

Google also pointed out that the encryption search only protects you from keywords tracking but the website you visit later could also be spotted because of you DNS queries. And that’s something they cannot do about. But that’s not the topic of this article. We can sure that the new HTTPS Google search does what it alleged (you can learn more Google SSL search from http://www.google.com/support/websearch/bin/answer.py?answer=173733&hl=en). Furthermore, the society is talking about the network security more and more these days. We should always pay attention to our communications on the Internet, emails, social media communications and passwords, and so on.

Packet Sniffer Tips: make use of packet size distribution statistics

2010年5月25日 6 条评论

Packet Size Distribution is an important statistic group in the Summary tab in Colasoft Capsa, from which we can get useful information. The Packet Size Distribution group does statistic over seven packet size ranges with their own throughput, packet counting, utilization, and so on. The bigger packet size may result in more Bytes if the packets number equals the ones with smaller packet size. These statistics seem just do simple statistics, but they also give us important information to help us monitor and analyze the network.

packet_size_distribution
The Packet Size Distribution Statistic Group in Summary Tab

The packet size distribution group can help us manage the network in the following ways:

1. Excessive <=64, 65-127 Packets: Attacks

We know ARP packets are 64 bytes and general TCP STN packets are about 66 bytes. Small sized packets contain less data. A network device needs to spend much of its resource to deal with excessive small sized packets which will result in inefficient to handle normal packets. So if the number is very big than other packet size statistic items, you should be alerted that it might be an attack such as ARP flooding, ARP spoofing, port scanning, worm activities, or DDoS attack.

2. Excessive 1024-1517, >=1518 Packets: Download

With larger size, a packet has a bigger payload to carry more data. That’s why downloading and uploading tools often generate packets with large sizes. These packets are very greedy to consume a big portion of bandwidth. That’s why network administrators always pay much attention to downloading and uploading at workplace. You should keep an eye on this type of packets too.

Note that here we are talking about EXCESSIVENESS, which means the number VERY BIG like tenfold or hundredfold bigger than other counters. Especially the small sized packets and if there is any port scanning on your network, you will capture a big sum of packets of 64 bytes in a blink of an eye and clearly feel the network delay.

How to Save Network Traffic to Hard Disk with Capsa?

2010年5月4日 6 条评论

Why do we need to preserve packets to local?

We all know that packets never lie. Saving packets to local means we have preservation of evidence on the network. One basic mission of a network analyzer is to capture network packets and save them to disk. To help us understand easily, we can compare the network analyzer as a monitoring camera. A monitoring camera continuously records image 24 hours a day and stores the movie for a certain time span. When we need to check what really happened in the past, we just replay the movie and we figure all out.
Capsa is like a network monitoring camera which is able to capture packets traveling in and out of the network and save the packets to a hard disk as packet files. Capsa listens to your order to save captured packets to a single file or multiple files by your splitting settings. My network traffic is very heavy, I don’t think my hard disk has enough space to hold those files, you may wonder. Under such circumstance, we can use filters to help us capture packets we are just interested in.

When do we need to save packets to local?

•Monitor network activities such as downloading, using IM, sending Email
•Recording traffics when the network admin not around. We can check last night’s network health status the second morning
•A network problem can’t be solved. We can save traffics to a packet file and turn to other technicians for help.

How to save packets to hard disk?

Finally let’s see how to save network packets to a hard disk. There are just a few simple steps of settings to accomplish this. But please make sure you have enough space to store those files on your hard disk.
1. Click the Packet Storage icon (figure below) on the Ribbon to open the Analysis Profile Options dialog box.
packet_storage_icon

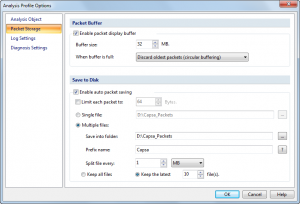
2. This is the Packet Storage page of the Analysis Profile Options. Check the Enable auto packet saving box in the Save to Disk group.
analysis_profile_options

Now, we will go through the options one by one:
2.1 Limit each packet to: If this box checked, only the first configured number of bytes of a packet will be saved. The excessive bytes will be discarded.
2.2 Single file: We should enable this option if we just need to store the packets to one packet file.
2.3 Multiple files: We should use this one when we need to capture packets for a long time. Capsa will split packets into multiple files according to the setting rules. It’s more useful for later analysis and traffic management. For example, we split packets by a time span of 24 hours. We only need to replay and analyze the packet file of that day which makes us focus on that traffic and make it easily to troubleshoot the network problems.
2.3.1 Save into folder: To choose a folder to store the packet files.
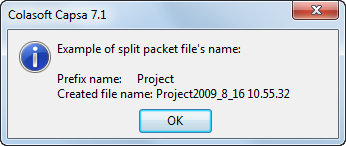
2.3.2 Prefix name: To set the file prefix for the packet files. We can click the ? button to see how the file names will be generated (figure below).
name_example

2.3.3 Split file every: Set the conditions for how to separate files. There are two conditions, by time or by file size. You can decide which one to choose by your certain network environment.
2.3.4 Keep all files/Keep the latest: If we choose to keep the latest number files, only the latest number of files will be kept and the older files will be deleted. To choose this option, we can save the space to store the packets files. Also the files exceed a long time are useless anymore.
When we need go back to pinpoint a network problem happened in the past, we just choose the interested packet files in the replay functionality of Capsa to reproduce the scenario of that time.

Detecting Trojan and Worm with Capsa Network Analyzer

2010年4月30日 9 条评论

Trojan and Worms are two major threats to network security. Do you know what exact is a Trojan horse? In Wikipedia, Trojan horses are designed to allow a hacker remote access to a target computer system. Once a Trojan horse has been installed on a target computer system, it is possible for a hacker to access it remotely and perform various operations.

Almost all Trojans and worms need an access to network, because they have to send data out to the hacker. Only the useful data are sent to the attacker the Trojan accomplishes its mission. So it should be a good solution that we start from the aspect of traffic analysis and protocol analysis technology. We are going to detect the Trojan horse and worm with the help of a –network analyzer-Colasoft Capsa. Capsa is an easy-to-use and intuitive network analyzer, which provides enough information to help check if there is any Trojan activities in our network. In this article I’m going to show you how to spot a Trojan or worm.

5 solutions to find the trace of a Trojan or worm in LAN network:

Solution 1: The Summary Tab

1
Concentrate on TCP packet summary. We should be alerted when TCP SYN Sent number is much larger than TCP SYN ACK Sent number. Generally the ratio of these two numbers approximately equals 1:1. Trojans and worms always send large amount of TCP SYN packet to the network and try to establish connections with other machines. When a connection established, they try to penetrate into the target machine.

Solution 2: IP Endpoint Tab

2
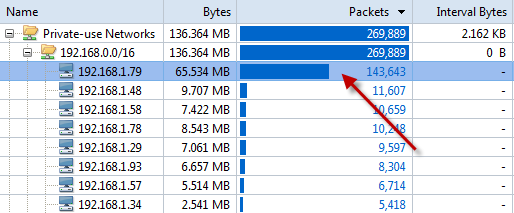
We can reorder the rows by clicking the column headers of the Packet Sent, Packet Received or IP conversation. Pay attention to the node with big statistics. They, however, might be BitTorrent downloading. But Trojans and worms definitely send out a large amount of packets.

Solution 3: The Log Tab

3
Focus on the DNS Log. We could make a list of target websites of Trojan horses by Google. For example, website like *****.3322.org. Furthermore, we can store the DNS log and analyze by using filters of the Trojans’ keywords.

Solution 4: Using Filters

04
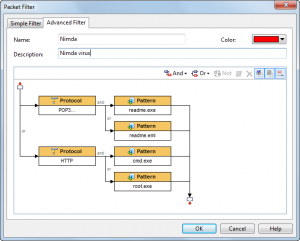
Build filters rules with patterns of some Trojans and worms. Until they send a packet out, we will get those Trojans’ and worms’ activities. This method has its drawback that it does nothing to a new Trojan or worm.

Solution 5: The TCP Conversation Tab & UDP Conversation Tab

5
6
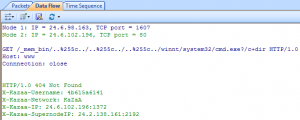
When Trojan or worm activities are found in our network, we can locate the machine’s IP address in the Node Explorer and then check its TCP Conversation or UDP Conversation. In TCP Conversation tab, we can read the reconstructed data of the communication in Data Flow sub tab, (the UDP Conversation is with the Data sub tab). Attentions have to be paid if the conversation is sending your system information.
Above are the featured tabs of Capsa network analyzer that we often use to detect network problems or bottlenecks. Moreover, we can spend some time to study what ports do the Trojans and worms like to use such as Executor:80, Ultors Trojan:1234. Then when we troubleshoot the network and make the analysis, we should pay attention to the node sending or receiving packets to and from these ports as well.

Long Island Rail Road has chosen Capsa Network Analyzer

2010年4月27日 3 条评论

After trying out the demo version, Long Island Rail Road gives a thumbs-up to Colasoft Capsa Analyzer and chooses Capsa to be the guardian of its digital health.

The Long Island Rail Road (reporting mark LI) or LIRR is a commuter rail system serving the length of Long Island, New York that has been classified as a Class II railroad by the Surface Transportation Board. It is the busiest commuter railroad in North America, servicing around 81 million passengers each year, and the oldest US railroad still operating under its original name and charter. There are 124 stations on the LIRR, and more than 700 miles (1,100 km) of track on its two lines to the two forks of the island and eight major branches.

分类: News & Events 标签:

How to improve network protocols learning and teaching

2010年4月26日 9 条评论

In computing, a protocol is a set of rules which is used by computers to communicate with each other across a network. A protocol is a convention or standard that controls or enables the connection, communication, and data transfer between computing endpoints. In its simplest form, a protocol can be defined as the rules governing the syntax, semantics, and synchronization of communication. Protocols may be implemented by hardware, software, or a combination of the two. At the lowest level, a protocol defines the behavior of a hardware connection. A protocol is a formal description of message formats and the rules for exchanging those messages.

Today, there are many universities or institutes opening training section of network protocols. More and more people interested in computer programming are learning network protocols. They get training, have books or videos, they are fabulous about protocols. Network protocol analyzer is regarded as the best tool to help improve network protocols learning and teaching. There are many people using Wireshark to help learn or teach network protocols, Colasoft Capsa can also do this, and maybe better.

Now, let’s see how Capsa helps to improve network protocols learning and teaching in a more graphical and intuitive way.

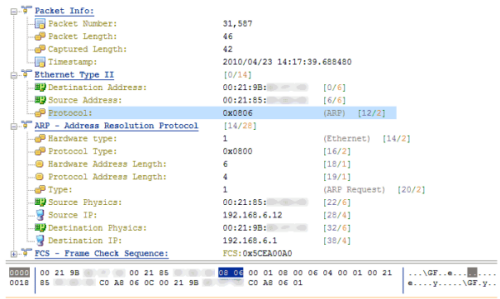
Protocol decoding is the basic functionality as well. There is a Packet tab, which collect all captured packets or traffic. Select a packet and we can see its hex digits as well as the meaning of each field. The figure below shows the structure of an ARP packet. This makes it easy to understand how the packet is encapsulated according to its protocol rule.
001

For more complicated study such as how to establish a TCP connection by a three-way handshake, how to close a TCP connection, how the window size changes, and how to calculate the TCP SEQ number and ACK number, the Time Sequence functionality is helpful and intuitive. The Time Sequence tab displays the packet movement of a TCP conversation with two-direction arrows. The following figure sketches a complete process of a TCP conversation, from connection establishment to connection close. The columns on the left side of the arrows show the calculation of sender’s SEQ and ACK numbers. And also we can see the window size. On the right-side of the arrows, they are the receivers’.
002

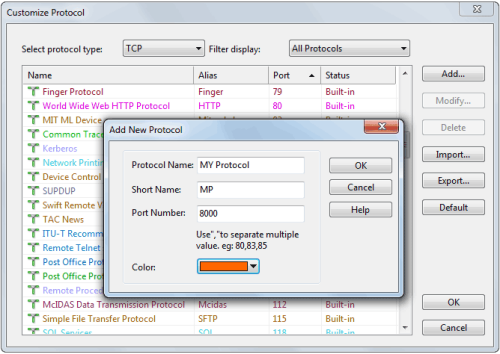
Furthermore, for scientific research in network communication and protocols, we may need to create protocols of our own. Colasoft Capsa allows us to customize protocols. It’s very easy to create a protocol rule of TCP, UDP, IP and Ethernet II. See figure below.
003

Colasoft Capsa is a powerful protocol analyzer shipped with four powerful tools-packet builder, packet player, ping tool and mac scanner. The packet builder helps teachers and rookies to create or build packets like ARP, IP and TCP packets. The packet player can be used to send packets into the network to test the network. You can also import packet files captured by other network sniffers as well. With the assistance of network protocol sniffer tools, the theories on the book will no longer be dry and boring. Let Caps help you dig into the micro network world.

Colasoft Packet Builder/Player Now Support Windows 7

2010年4月12日 3 条评论

Colasoft Packet Builder and Packet Player are very useful free tools. The latest versions, Packet Builder 1.0.1 and Packet Player 1.2.1 can support windows 7.

Colasoft Packet Builder

Colasoft Packet Builder enables creating custom network packets; users can use this tool to check their network protection against attacks and intruders.Colasoft Packet Builder includes a very powerful editing feature. Besides common HEX editing raw data, it features a Decoding Editor allowing users to edit specific protocol field values much easier.

Colasoft Packet Player

Colasoft Packet Player is a packet replayer which allows users to open captured packet trace files and play them back in the network. It supports many packet trace file formats created by sniffer software, such as Coalsoft Capsa, Ethereal, Network General Sniffer and WildPackets EtherPeek/OmniPeek, etc.

Except sending packet files in original interval between loops, Colasoft Packet Player also supports sending packet files in burst mode and defining the delay between loops if the loop count is more than one.

How to find the top bandwidth users with Capsa?

2010年4月12日 2 条评论

Sometimes when our network is going abnormal, we need to find out and check the top bandwidth users for clues, such as BitTorrent downloading, online video, worm activities, and so on. With Capsa 7, you don’t need to do any settings or configurations. All you need to do is to run the program, and get the statistic results with a couple of clicks.

First, let’s start Capsa7.1, we’d better not set any filters, unless we are monitor a specific kind of traffic. Then, we just keep the program running.

1

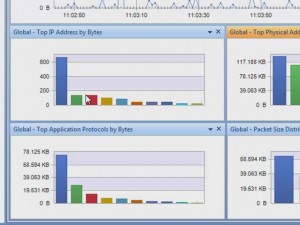
We first t come to the dashboard. By default, there’re two graphs in the dashboard, providing top talkers statistic results. They are Top physical address by bytes, and top IP address by bytes. By default, they display the top 10s. We can move pointer over a bar to see its address. In this network, the IP address, 192.168.5.24 (one ninety two, dot one sixty eight, dot five dot twenty four), consumes the biggest portion of bandwidth.

2

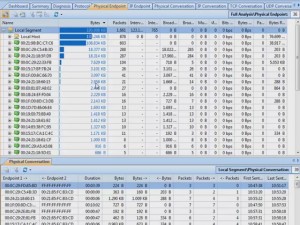
If we need detailed statistics of those nodes, we can come to the physical endpoint tab, or Ip endpoint tab. We can click the column header to order the list. Click this column to order by bytes. We can see who take the most traffic. We can see these highlighted bars; they help us recognize the column difference. Also we can click packets to see, who send out the most packets. From these statistics, we can get hints of anomalies, such as downloading and online video takes a lot of bandwidth, and some worm or attacks sends a great number of packets. The difference is we get MAC address in this tab, and IP address in another tab.

3

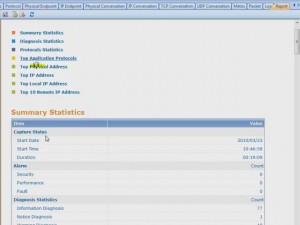
For some occasion, we need to generate a report of the top bandwidth users. Capsa 7.1 has the report function, let’s move on to the report tab. It provides five top statistic groups. Click an item; we see it’s an easy-to-understand table with information of IP address, traffic consumption percentage, bytes and packets.

4

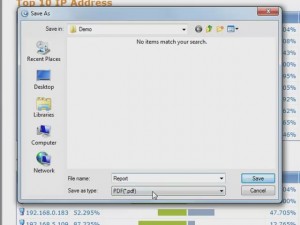
If we want to save the report, click this button, choose a folder, type in a file name, then we can choose to save the report in PDF or html. Click Save. Report saved, and we can see the webpage is the same in the report tab.

5

Watch the video tutorial at http://www.colasoft.com/download/top_10_network_traffic_hosts.php

How to Detect Possible Network Loops in Network?

2010年4月12日 23 条评论

Do you know what a network loop is? Have you ever had a network loop in your LAN? No matter you want it or not, a network loop in the LAN can bring down your whole network.

First, let’s see what a network loop is. What does a network loop do? A network loop is a network configuration there is more than one path between two computers or devices, which causes packets to be constantly repeated. This is due to the fact that a hub will blindly transmit everything it receives to all connections – other devices, such as switches and routers, might be able to reduce or eliminate this problem.

In this article, I’m going to show you how to detect the network loops in network with Capsa network analyzer 7.1?

Let’s start Capsa, and then add in the packet file into the ready-to-replay list. Without any other settings, click this icon to start replay directly.
01
To detect network loops, first we come to the Dashboard tab. The graphs show that the traffic is not big. We can conclude that, no machine is keeping sending a large sum of packets, to block the bandwidth.
02
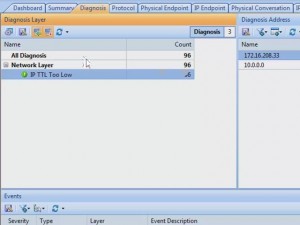
We can sure from the Protocol tab, that only ICMP is used in the traffic. However, in Diagnosis tab, there is one record, IP TTL too low, which means a packet has passed too many routers. That is a sign od network loop.
03
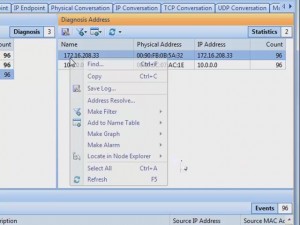
And we can see the anomaly happens at IP address, one seventy two, dot sixteen, dot two zero eight, dot thirty three. Let’s start from this address. Right-click on the address, and locate it.
04
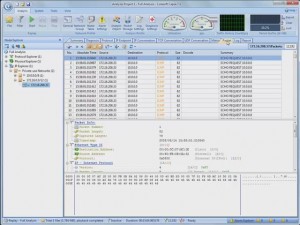
Then, go directly to the packet tab. We can see all the packets are ICMP packets. And we find the delta time between the packets is very small, and there are more than twelve thousand packets. This couldn’t be normal. Just a simple ping can’t produce so many packets, it looks like network loop a little bit.
05
To confirm our guess, we should go down to the digits in the packets. We can compare the field information of different packets, by checking the fields in this pane. While we come to the identification field, we can see there are so many packets have the same identification number. We know that one ICMP packets has its own identification number, there’s no way that so many packets have the same number. Now we are much sure it’s a network loop. But to make sure of this, we need to see another important field, TTL value. Check the Time To Live field. We can see that the same ICMP packet loops around the router, and each time it passes the router, its TTL value is reduced by one. Until its TTL value comes to zero, it’s dropped by the router. Then another packet does it again.
06
This is the end of the story. Hope you already know how to find out network loop in network with network sniffer.
A video tutorial for troubleshooting network loops is avaliable at http://www.colasoft.com/download/arp_flood_arp_spoofing_arp_poisoning_attack_solution_with_capsa.php