存档

‘Tips & How-tos’ 分类的存档

Packet Sniffer Tips: make use of packet size distribution statistics

2010年5月25日 6 条评论

Packet Size Distribution is an important statistic group in the Summary tab in Colasoft Capsa, from which we can get useful information. The Packet Size Distribution group does statistic over seven packet size ranges with their own throughput, packet counting, utilization, and so on. The bigger packet size may result in more Bytes if the packets number equals the ones with smaller packet size. These statistics seem just do simple statistics, but they also give us important information to help us monitor and analyze the network.

packet_size_distribution
The Packet Size Distribution Statistic Group in Summary Tab

The packet size distribution group can help us manage the network in the following ways:

1. Excessive <=64, 65-127 Packets: Attacks

We know ARP packets are 64 bytes and general TCP STN packets are about 66 bytes. Small sized packets contain less data. A network device needs to spend much of its resource to deal with excessive small sized packets which will result in inefficient to handle normal packets. So if the number is very big than other packet size statistic items, you should be alerted that it might be an attack such as ARP flooding, ARP spoofing, port scanning, worm activities, or DDoS attack.

2. Excessive 1024-1517, >=1518 Packets: Download

With larger size, a packet has a bigger payload to carry more data. That’s why downloading and uploading tools often generate packets with large sizes. These packets are very greedy to consume a big portion of bandwidth. That’s why network administrators always pay much attention to downloading and uploading at workplace. You should keep an eye on this type of packets too.

Note that here we are talking about EXCESSIVENESS, which means the number VERY BIG like tenfold or hundredfold bigger than other counters. Especially the small sized packets and if there is any port scanning on your network, you will capture a big sum of packets of 64 bytes in a blink of an eye and clearly feel the network delay.
How to Save Network Traffic to Hard Disk with Capsa?

2010年5月4日 6 条评论

Why do we need to preserve packets to local?

We all know that packets never lie. Saving packets to local means we have preservation of evidence on the network. One basic mission of a network analyzer is to capture network packets and save them to disk. To help us understand easily, we can compare the network analyzer as a monitoring camera. A monitoring camera continuously records image 24 hours a day and stores the movie for a certain time span. When we need to check what really happened in the past, we just replay the movie and we figure all out.
Capsa is like a network monitoring camera which is able to capture packets traveling in and out of the network and save the packets to a hard disk as packet files. Capsa listens to your order to save captured packets to a single file or multiple files by your splitting settings. My network traffic is very heavy, I don’t think my hard disk has enough space to hold those files, you may wonder. Under such circumstance, we can use filters to help us capture packets we are just interested in.

When do we need to save packets to local?

•Monitor network activities such as downloading, using IM, sending Email
•Recording traffics when the network admin not around. We can check last night’s network health status the second morning
•A network problem can’t be solved. We can save traffics to a packet file and turn to other technicians for help.

How to save packets to hard disk?

Finally let’s see how to save network packets to a hard disk. There are just a few simple steps of settings to accomplish this. But please make sure you have enough space to store those files on your hard disk.
1. Click the Packet Storage icon (figure below) on the Ribbon to open the Analysis Profile Options dialog box.
packet_storage_icon

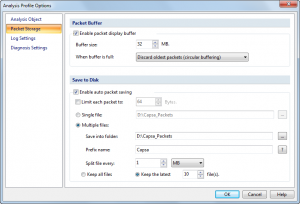
2. This is the Packet Storage page of the Analysis Profile Options. Check the Enable auto packet saving box in the Save to Disk group.
analysis_profile_options

Now, we will go through the options one by one:
2.1 Limit each packet to: If this box checked, only the first configured number of bytes of a packet will be saved. The excessive bytes will be discarded.
2.2 Single file: We should enable this option if we just need to store the packets to one packet file.
2.3 Multiple files: We should use this one when we need to capture packets for a long time. Capsa will split packets into multiple files according to the setting rules. It’s more useful for later analysis and traffic management. For example, we split packets by a time span of 24 hours. We only need to replay and analyze the packet file of that day which makes us focus on that traffic and make it easily to troubleshoot the network problems.
2.3.1 Save into folder: To choose a folder to store the packet files.
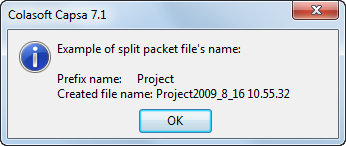
2.3.2 Prefix name: To set the file prefix for the packet files. We can click the ? button to see how the file names will be generated (figure below).
name_example

2.3.3 Split file every: Set the conditions for how to separate files. There are two conditions, by time or by file size. You can decide which one to choose by your certain network environment.
2.3.4 Keep all files/Keep the latest: If we choose to keep the latest number files, only the latest number of files will be kept and the older files will be deleted. To choose this option, we can save the space to store the packets files. Also the files exceed a long time are useless anymore.
When we need go back to pinpoint a network problem happened in the past, we just choose the interested packet files in the replay functionality of Capsa to reproduce the scenario of that time.

How to improve network protocols learning and teaching

2010年4月26日 9 条评论

In computing, a protocol is a set of rules which is used by computers to communicate with each other across a network. A protocol is a convention or standard that controls or enables the connection, communication, and data transfer between computing endpoints. In its simplest form, a protocol can be defined as the rules governing the syntax, semantics, and synchronization of communication. Protocols may be implemented by hardware, software, or a combination of the two. At the lowest level, a protocol defines the behavior of a hardware connection. A protocol is a formal description of message formats and the rules for exchanging those messages.

Today, there are many universities or institutes opening training section of network protocols. More and more people interested in computer programming are learning network protocols. They get training, have books or videos, they are fabulous about protocols. Network protocol analyzer is regarded as the best tool to help improve network protocols learning and teaching. There are many people using Wireshark to help learn or teach network protocols, Colasoft Capsa can also do this, and maybe better.

Now, let’s see how Capsa helps to improve network protocols learning and teaching in a more graphical and intuitive way.

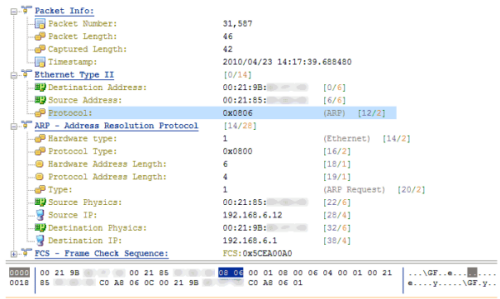
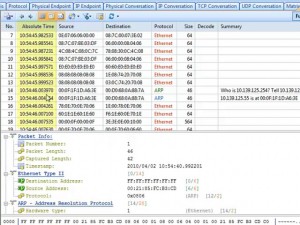
Protocol decoding is the basic functionality as well. There is a Packet tab, which collect all captured packets or traffic. Select a packet and we can see its hex digits as well as the meaning of each field. The figure below shows the structure of an ARP packet. This makes it easy to understand how the packet is encapsulated according to its protocol rule.
001

For more complicated study such as how to establish a TCP connection by a three-way handshake, how to close a TCP connection, how the window size changes, and how to calculate the TCP SEQ number and ACK number, the Time Sequence functionality is helpful and intuitive. The Time Sequence tab displays the packet movement of a TCP conversation with two-direction arrows. The following figure sketches a complete process of a TCP conversation, from connection establishment to connection close. The columns on the left side of the arrows show the calculation of sender’s SEQ and ACK numbers. And also we can see the window size. On the right-side of the arrows, they are the receivers’.
002

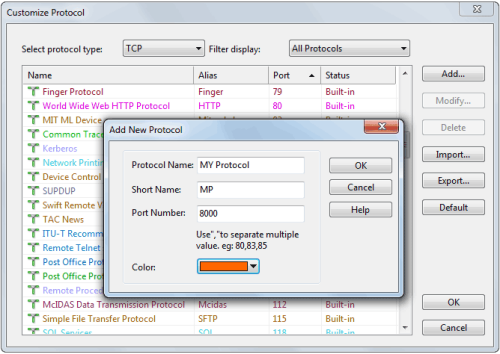
Furthermore, for scientific research in network communication and protocols, we may need to create protocols of our own. Colasoft Capsa allows us to customize protocols. It’s very easy to create a protocol rule of TCP, UDP, IP and Ethernet II. See figure below.
003

Colasoft Capsa is a powerful protocol analyzer shipped with four powerful tools-packet builder, packet player, ping tool and mac scanner. The packet builder helps teachers and rookies to create or build packets like ARP, IP and TCP packets. The packet player can be used to send packets into the network to test the network. You can also import packet files captured by other network sniffers as well. With the assistance of network protocol sniffer tools, the theories on the book will no longer be dry and boring. Let Caps help you dig into the micro network world.

How to find the top bandwidth users with Capsa?

2010年4月12日 2 条评论

Sometimes when our network is going abnormal, we need to find out and check the top bandwidth users for clues, such as BitTorrent downloading, online video, worm activities, and so on. With Capsa 7, you don’t need to do any settings or configurations. All you need to do is to run the program, and get the statistic results with a couple of clicks.

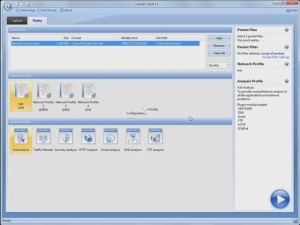
First, let’s start Capsa7.1, we’d better not set any filters, unless we are monitor a specific kind of traffic. Then, we just keep the program running.

1

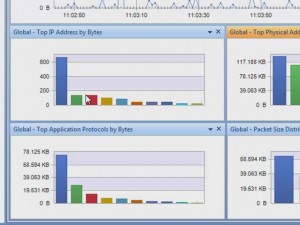
We first t come to the dashboard. By default, there’re two graphs in the dashboard, providing top talkers statistic results. They are Top physical address by bytes, and top IP address by bytes. By default, they display the top 10s. We can move pointer over a bar to see its address. In this network, the IP address, 192.168.5.24 (one ninety two, dot one sixty eight, dot five dot twenty four), consumes the biggest portion of bandwidth.

2

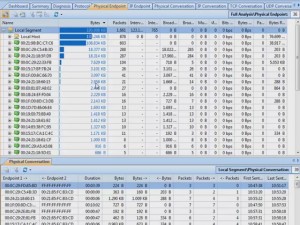
If we need detailed statistics of those nodes, we can come to the physical endpoint tab, or Ip endpoint tab. We can click the column header to order the list. Click this column to order by bytes. We can see who take the most traffic. We can see these highlighted bars; they help us recognize the column difference. Also we can click packets to see, who send out the most packets. From these statistics, we can get hints of anomalies, such as downloading and online video takes a lot of bandwidth, and some worm or attacks sends a great number of packets. The difference is we get MAC address in this tab, and IP address in another tab.

3

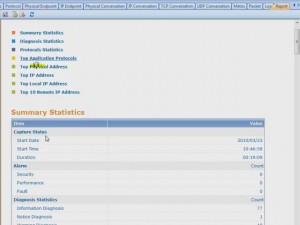
For some occasion, we need to generate a report of the top bandwidth users. Capsa 7.1 has the report function, let’s move on to the report tab. It provides five top statistic groups. Click an item; we see it’s an easy-to-understand table with information of IP address, traffic consumption percentage, bytes and packets.

4

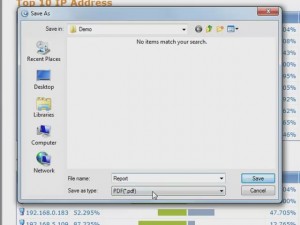
If we want to save the report, click this button, choose a folder, type in a file name, then we can choose to save the report in PDF or html. Click Save. Report saved, and we can see the webpage is the same in the report tab.

5

Watch the video tutorial at http://www.colasoft.com/download/top_10_network_traffic_hosts.php

How to Detect Possible Network Loops in Network?

2010年4月12日 23 条评论

Do you know what a network loop is? Have you ever had a network loop in your LAN? No matter you want it or not, a network loop in the LAN can bring down your whole network.

First, let’s see what a network loop is. What does a network loop do? A network loop is a network configuration there is more than one path between two computers or devices, which causes packets to be constantly repeated. This is due to the fact that a hub will blindly transmit everything it receives to all connections – other devices, such as switches and routers, might be able to reduce or eliminate this problem.

In this article, I’m going to show you how to detect the network loops in network with Capsa network analyzer 7.1?

Let’s start Capsa, and then add in the packet file into the ready-to-replay list. Without any other settings, click this icon to start replay directly.
01
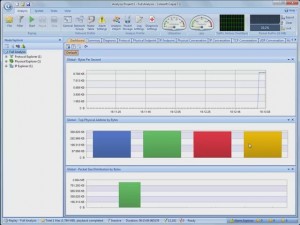
To detect network loops, first we come to the Dashboard tab. The graphs show that the traffic is not big. We can conclude that, no machine is keeping sending a large sum of packets, to block the bandwidth.
02
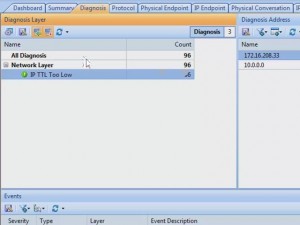
We can sure from the Protocol tab, that only ICMP is used in the traffic. However, in Diagnosis tab, there is one record, IP TTL too low, which means a packet has passed too many routers. That is a sign od network loop.
03
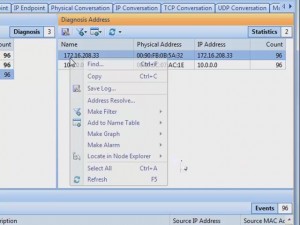
And we can see the anomaly happens at IP address, one seventy two, dot sixteen, dot two zero eight, dot thirty three. Let’s start from this address. Right-click on the address, and locate it.
04
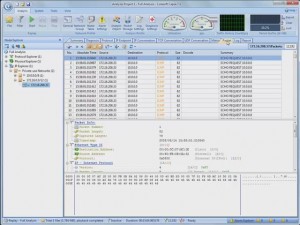
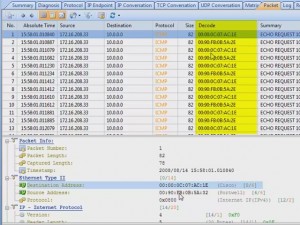
Then, go directly to the packet tab. We can see all the packets are ICMP packets. And we find the delta time between the packets is very small, and there are more than twelve thousand packets. This couldn’t be normal. Just a simple ping can’t produce so many packets, it looks like network loop a little bit.
05
To confirm our guess, we should go down to the digits in the packets. We can compare the field information of different packets, by checking the fields in this pane. While we come to the identification field, we can see there are so many packets have the same identification number. We know that one ICMP packets has its own identification number, there’s no way that so many packets have the same number. Now we are much sure it’s a network loop. But to make sure of this, we need to see another important field, TTL value. Check the Time To Live field. We can see that the same ICMP packet loops around the router, and each time it passes the router, its TTL value is reduced by one. Until its TTL value comes to zero, it’s dropped by the router. Then another packet does it again.
06
This is the end of the story. Hope you already know how to find out network loop in network with network sniffer.
A video tutorial for troubleshooting network loops is avaliable at http://www.colasoft.com/download/arp_flood_arp_spoofing_arp_poisoning_attack_solution_with_capsa.php

How to Detect MAC Flooding Attack in your LAN?

2010年4月6日 9 条评论

In a typical MAC flooding attack, a switch is flooded with packets, each containing different source MAC addresses. The switch records these addresses to its CAM table. When the table is full, the switch cannot look up the right destination port, but to broadcast out on all ports. A malicious user could then use a packet sniffer running in promiscuous mode to capture sensitive data from other computers, which would not be accessible were the switch operating normally.

How to detect if there’s a MAC flooding attack in the network? In this article, I will demonstrate to you with Colasoft Capsa Analyzer.

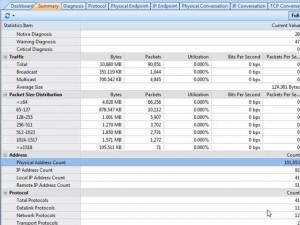
For detecting MAC flooding attack. Let’s start capture, we start the analysis from the SUMMARY TAB. All these statistics seem right. Except one when we come to the Physical address count. There are more than a hundred thousand MAC addresses discovered in this network. How could this small network have so many machines? Possibly, it is a mac flooding attack.

1

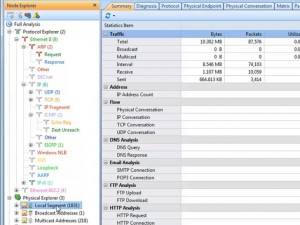
We need to check the addresses in the NOD EXPLORE. Open the physical explorer, and look this number; there are more than 1800 MAC addresses in local segment. It’s abnormal; there is no way that so many machines exist in this network. And apparently, these addresses are not real. We are sure that there are worm activities, or attacks in the network.

2

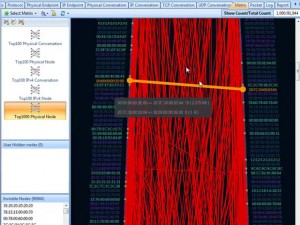
Let’s see how these nodes are communicating. Open the MATRIX TAB. And we choose Top 1000 physical node matrix type. We see this matrix, what a mess! There are so many nodes communicating, and according to the colors of the line, red means one way transmitting.

3

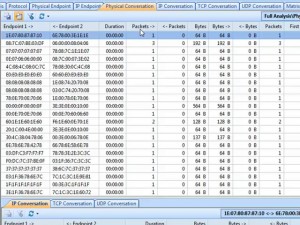
And we can go to the PHYSICAL CONVERSATION TAB to read that it’s true. Almost all nodes only send one packet out. Most packets are 64 bytes.
We know that all machines in our network are connected with a switch. This looks like a MAC flooding attack.

4

Still, to confirm our prediction, we need to see the original data of the packets they send out. Open the PACKET TAB. We see the delta time between packets is very small, which gives a great pressure to the switch. Almost all packets are 64 bytes. And let’s look at the original data in the packets. Almost all packets are randomly generated by padding same digits in the packets.

5

According to all these behaviors, and decoded information from packets, we are pretty sure that there is MAC flooding in this network. But it’s hard to find the attacker’s address directly because all addresses are forged. However, we can cut some machines off the network to eliminate the innocent machines until we find the target one.
Watch the video tutorial of detecting MAC flooding attack is avaliable at Here!

How to Detect Email Worm with Colasoft Packet Sniffer

2009年6月24日 7 条评论

What Is an Email Worm
In networking, an email worm is a computer worm which can copy itself to the shared folder in system. And it will keep sending infected emails to stochastic email addresses. In this way, it spreads fast via SMTP mail servers.

What Is the Harm of Email Worm
An email worm can send lots of infected emails in a very short time and it will never stop unless it’s removed. It will cause a large traffic and make the system go slowly. Sometimes it even makes the mail server crash.

How to Detect Email Worm
If you are suspicious some host in your network is infected with an email worm, here is a process how we can detect email worm in network with Colasoft Packet Sniffer, step by step.

>Step1. Download a free trial and deploy it properly.

>Step2. Launch a Project and Start Capturing Some Traffic.

>Step3. Switch to “Diagnosis” Tab
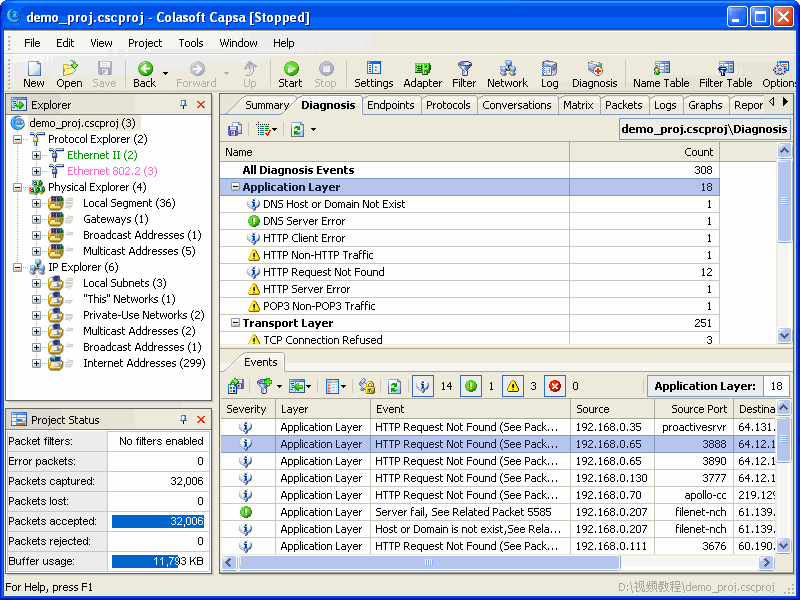
Diagnosis tab is a view we can see all the network issues automatically detected by Colasoft Packet Sniffer, also some causes and solutions are suggested.

Diagnosis Tab Screenshot

Diagnosis Tab Screenshot

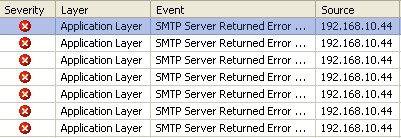
If there is a host infected with an email worm, we should be able to see SMTP events in the application layer like this:

SMTP Events in Application Layer

SMTP Events in Application Layer

>Step4. Locate the Source IP
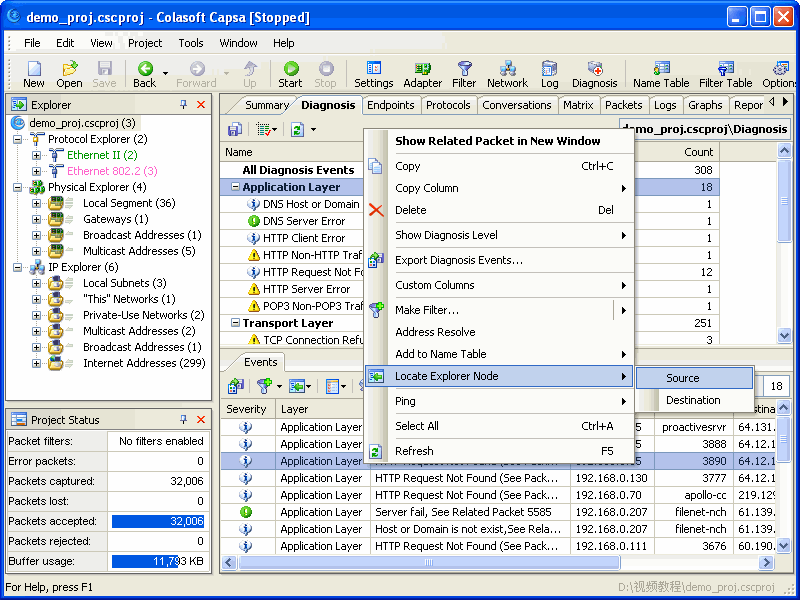
Possibly the source IP is the host infected with an email worm as it is sending too many emails in a short period of time with SMTP. So let’s locate the source IP in the “Explorer” with the “Locate” shortcut in the right-click menu.

Locate Source IP

Locate Source IP

>Step5. Switch to “Logs” Tab
Check if the host is sending emails to a large number of recipients in a very short period of time. If so, we can determine the host is infected with an email worm and should be handled immediately. We should be able to see logs in the Tab like this:

View Email Logs in "Logs" Tab

View Email Logs in "Logs" Tab

No doubt the final step is to isolate the host and kill the email worm with some AV software

Also there will be some other process to detect email worm with Colasoft Packet Sniffer, this is the shortest one.

How to Track BitTorrent User in Network with Colasoft Packet Sniffer

2009年6月10日 7 条评论

BitTorrent Consumes Big Bandwidth
Based on the working principle of BitTorrent protocol, if somebody is downloading big files with BitTorrent software, it will be a disaster for other users who need bandwidth for business operations as the user will consume large amount of bandwidth, thus causing long time network slowness, intermittence, even disconnections; because meantime the user downloading files from others, others are downloading files from him.

So it is necessary for IT administrators to track BitTorrent user at first place to regain network bandwidth for business operations. Blocking BitTorrent protocol can be one way; this article is to discuss how to track BitTorrent users with Colasoft Packet Sniffer.

How to Track BitTorrent User?

>Step1. Download a free trial and implement it correctly

>Step2. Launch a project and start capturing data

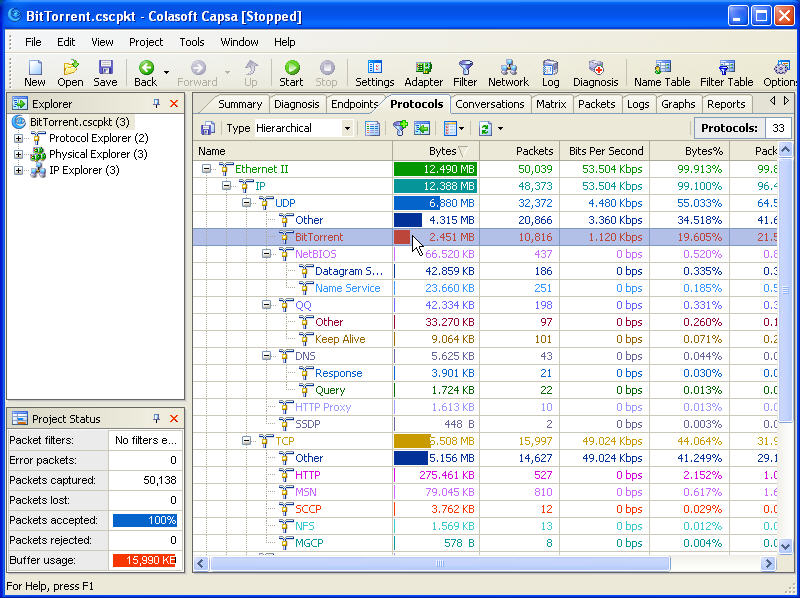
>Step3. Find BitTorrent Protocol in the “Protocols” Tab

Track BitTorrent User Screenshot 1

Track BitTorrent User Screenshot 1

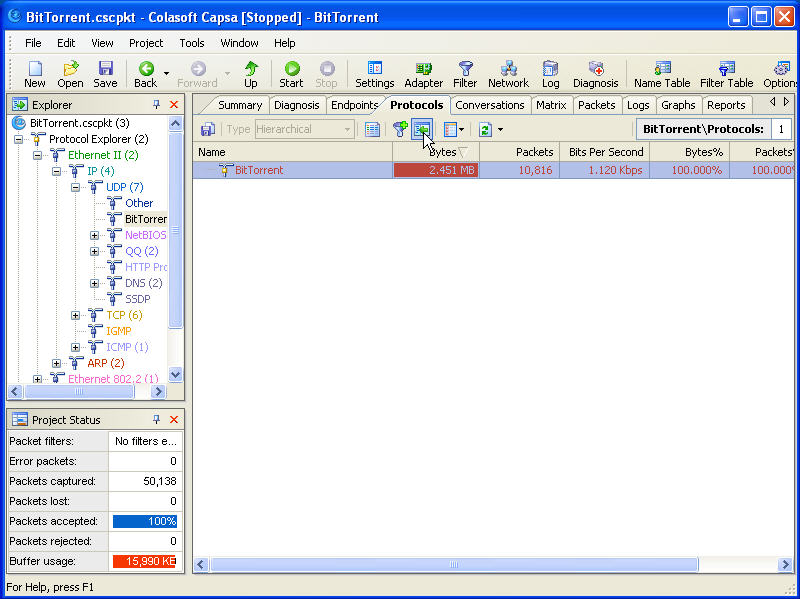
>Setp4. Locate BitTorrent Protocol in the “Explorer”
Use the “Locate” function to locate BitTorrent protocol in the “Explorer” to analyze dedicated data.

Track BitTorrent User Screenshot 2

Track BitTorrent User Screenshot 2

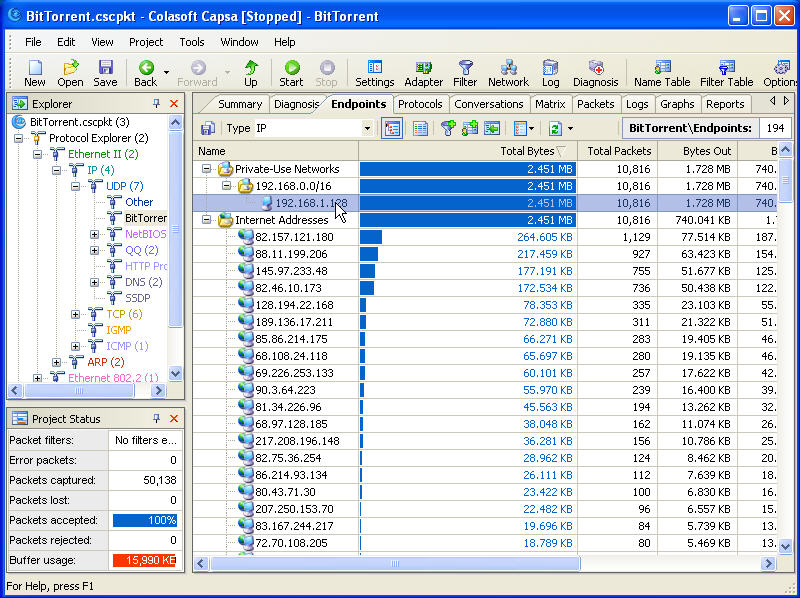
>Step5. Track BitTorrent User in LAN in the “Endpoint” Tab
This is the way how to track the BitTorrent user in our network and who are connected with him. There is a lot more we can see from this tab, such as how much data has been downloaded and uploaded via BitTorrent protocol.

Track BitTorrent User Screenshot 3

Track BitTorrent User Screenshot 3

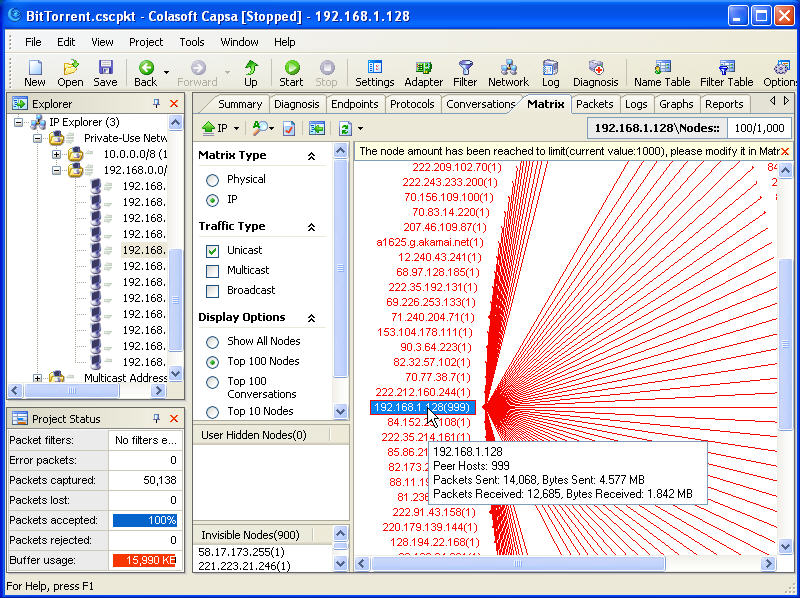
View how many connections have been built in “Matrix”
You’ll be shocked to see how many connections have been built in the “Matrix” Tab. In this case, we can see this user has built more than 1000 connections with other hosts.

Track BitTorrent User Screenshot 4

Track BitTorrent User Screenshot 4

About BitTorrent
BitTorrent is a peer-to-peer file sharing protocol used for distributing large amounts of data. BitTorrent is one of the most common protocols for transferring large files.

The protocol works when a file provider initially makes his/her file (or group of files) available to the network. This is called a seed and allows others, named peers, to connect and download the file. Each peer that downloads a part of the data makes it available to other peers to download. After the file is successfully downloaded by a peer, many continue to make the data available, becoming additional seeds. This distributed nature of BitTorrent leads to a viral spreading of a file throughout peers. As more peers join the swarm, the likelihood of a successful download increases. Relative to standard Internet hosting, this provides a significant reduction in the original distributor’s hardware and bandwidth resource costs. It also provides redundancy against system problems and reduces dependence on the original distributor.

Next Step
>>Download a Free Trial

How to Monitor MSN Chat with Free Unipeek MSN Monitor

2009年6月5日 8 条评论

For some purposes we want to monitor MSN chat around the network, for example, parents want to monitor MSN chat of their kids to ensure their safety; bosses want to monitor MSN chat of employees for company assets security and to improve work efficiency by minimizing none-business chat during working hours. You may still remember Colasoft MSN Monitor, now it is called Unipeek MSN Monitor and it is distributed completely Free for none commercial users.

Now let’s see how we can monitor MSN chat with Unipeek MSN Monitor, the free tool.

Step1. Download Unipeek MSN Monitor

Download Unipeek MSN Monitor, the free edition; from the website. As a matter of fact there is no function difference between Unipeek MSN Monitor the free edition and the commercial edition. The only difference is Unipeek MSN Monitor Free Edition only supports 10 MSN accounts maximum, but quite enough for family users.

Step2. Install and Deploy Unipeek MSN Monitor

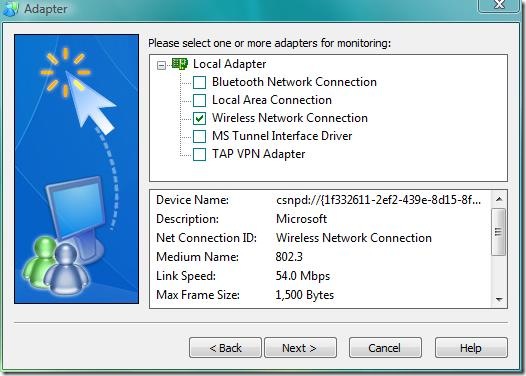
The installation is quick and simple, just click “next” all the way to complete the installation. But the deployment is somewhat different. As Unipeek MSN Monitor is designed based on Colasoft’s packet capturing technology, so it has to be deployed properly like a packet sniffer if you want to monitor all MSN chat around the network. Of course, you don’t have to do it if you only want to monitor MSN chat of a single computer. To monitor multiple computers, you can install multiple copies.

How to Monitor MSN Chat Screenshot 1

How to Monitor MSN Chat Screenshot 1

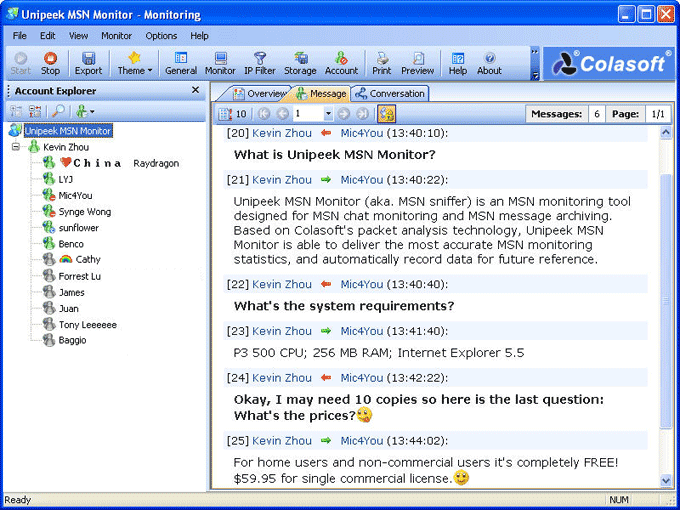
Setp3. Run it and Start Monitor MSN Chat

After proper installation and deployment, we can start monitoring MSN chat right away.

How to Monitor MSN Chat Screenshot 2

How to Monitor MSN Chat Screenshot 2

About Unipeek MSN Monitor
Unipeek MSN Monitor (MSN sniffer) is Free MSN monitoring software for MSN chat monitoring and MSN message archiving. Based on Colasoft’s packet analysis technology, Unipeek MSN Monitor is able to deliver the most accurate MSN monitoring statistics, and automatically record data for future reference. You need only install Unipeek MSN Monitor once to monitor all MSN chats over the local network.

Key Features include:
•    Real-time and 24/7 MSN chat monitoring
•    Automatically archive MSN messages for future reference
•    Export messages of a custom time range
•    Customize MSN account list to be monitored
•    Unique Conversation Matrix showing account relations
•    Support emotion icons, message font size and color.

Download Now
Download Unipeek MSN Monitor

How to Monitor Email with Colasoft Packet Sniffer

2009年5月20日 5 条评论

Some people may doubt if it is legal to monitor email of employees with an email monitor software (aka. email spy or email checker), but this is not the topic of this article. We are going to discuss how we can monitor email with some technical methods, especially how we can monitor email with this packet sniffer – Colasoft Capsa.

Step 1. Still we need to download a free trial and deploy it correctly.

Step 2. Launch a project

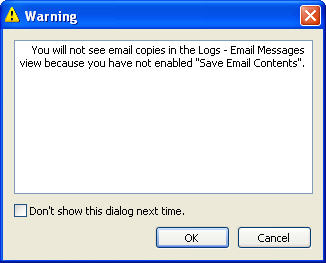
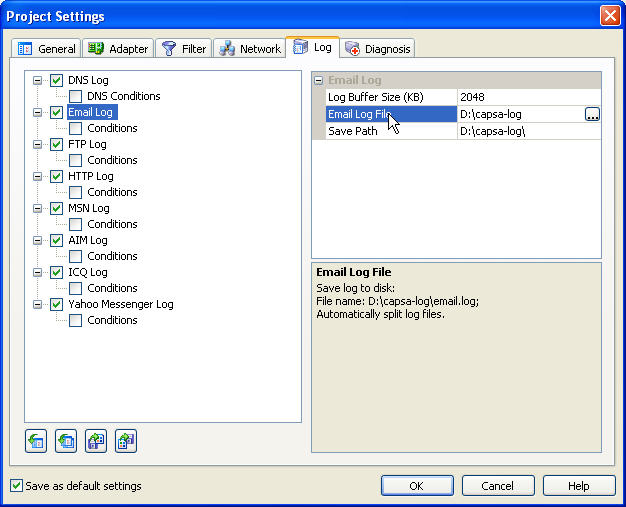
If we have not set Capsa to save email logs to a local disk, we’ll not be able to monitor email contents but we can monitor all email logs. So we must set the log settings to save email logs to a local path in order to monitor email contents. Also there will be a notice when start a new project.

Monitor Email Screeshot1

Monitor Email Screeshot1

Setp3. Set Email Logs Settings

View full image to set the email logs setting correctly.

Monitor Email Screenshot2 - Click to view Large

Monitor Email Screenshot2 - Click to view Large

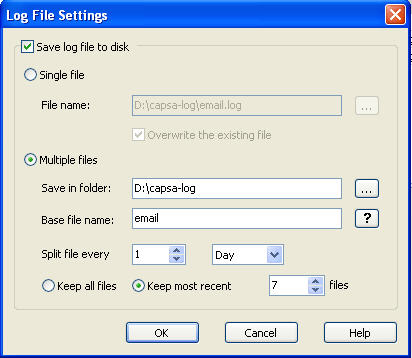
Advanced Email logs settings to split email logs and keep the most recent email logs to save disk space.

Monitor Email Screeshot3

Monitor Email Screeshot3

Step 4. Start Capturing and Monitoring Email in “Logs” Tab

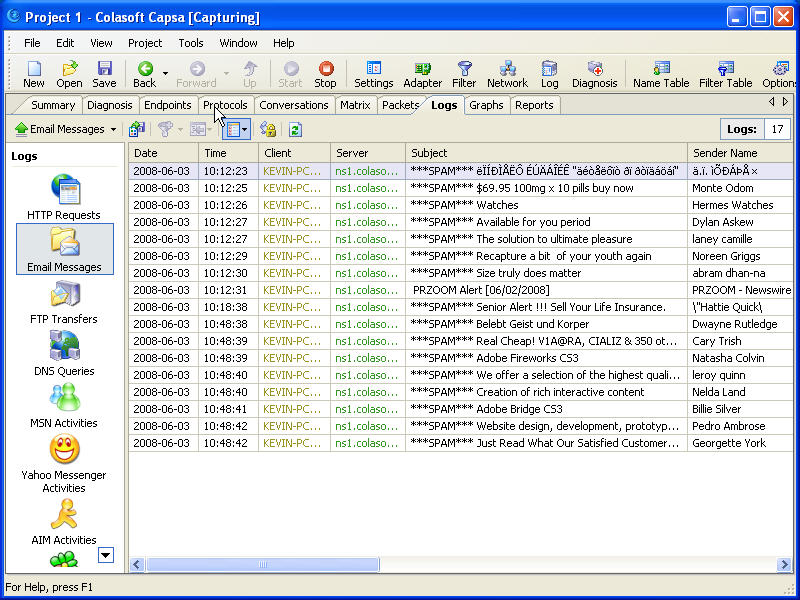
After email log settings is finished, we can do a test to see if we can get some email monitoring logs. Let’s launch Outlook and start sending and receiving emails. We can see that we’ve received many spam email in my email box. We can see a lot of information in the logs Tab, such as date and time, client name, email subject, sender and receiver name, size, and more.

Monitor Email Screeshot - Click to View Large

Monitor Email Screeshot - Click to View Large

Step 5. Monitor Email Contents

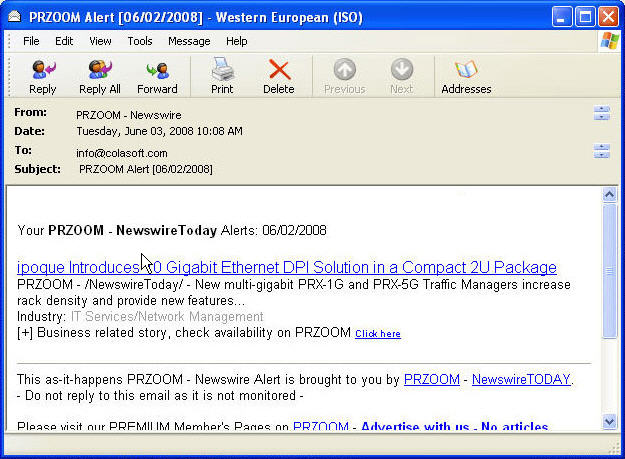
In order to view the original content of an email, the process is quite simple, just double-click on the logs, then Capsa will call an email software to display the email content, basically Outlook.

Monitor Email Screeshot5 - Click to View Large

Monitor Email Screeshot5 - Click to View Large

Now this is the entire process how we can monitor email with Colasoft Capsa, we hope you enjoy this article.

Next Step
>>Download a Free Trial