存档

文章标签 ‘how to’

nChronos How-to: Migrating Configuration Files from nChronos Evaluation to an nChronos Licensed Version

2014年7月8日 没有评论

Migrating configuration files on the same machine

The following steps will allow you to migrate configuration files from an nChronos Evaluation to an nChronos Licensed version on the same machine.

  1. When uninstalling nChronos Evaluation program please click “Yes” when following box pops up:
  2. Install the nChronos Licensed version. By clicking this uninstall “Save” action all configurations and captured data files will be saved automatically.

Migrating configuration files to a different machine

Follow the following steps if you installed the nChronos Evaluation version on one machine and now want to migrate the files to an nChronos Licensed version on a different machine,

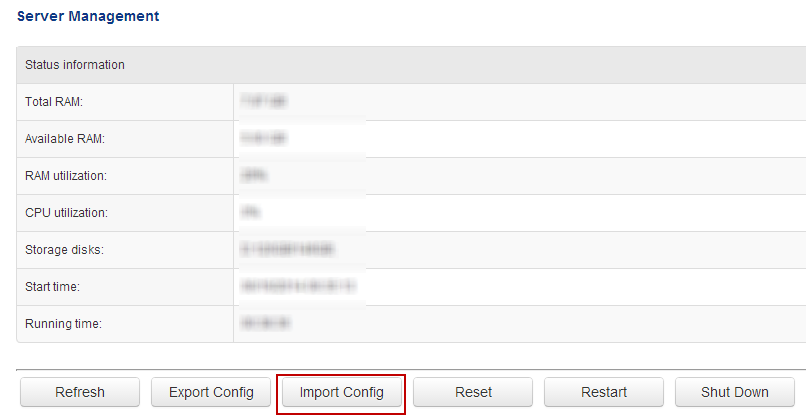
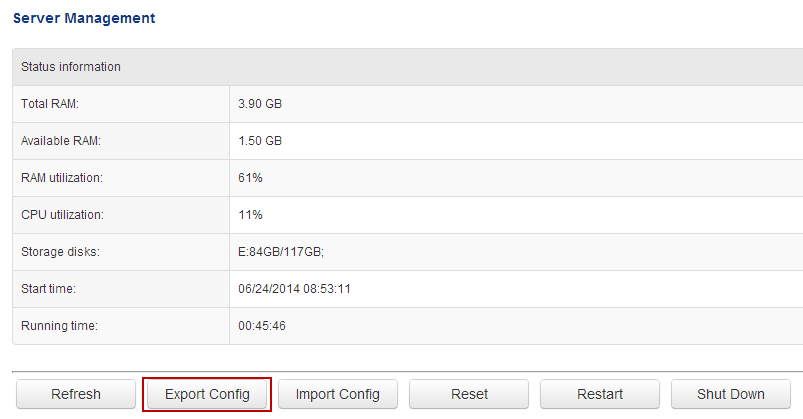
  1. Export the configurations from nChronos Evaluation. Login to the nChronos Server web portal then go to the Server Management page and click Export Config button to save the configurations:
  2. Install and activate the new licensed version of nChronos. Login to the nChronos Server web portal, go to the Server Management page, and click the Import Config button to import the saved file in step 1.
  3. After the import is complete the nChronos service will automatically restart. After the restart, the configuration files will now be migrated.

Download Capsa

source: colasoft.com

分类: Tips & How-tos 标签: ,

Find out which process/application is using which TCP/UDP port on Windows

2011年1月20日 3 条评论

During the process of analyzing a network problem with a network analyzer tool or a protocol sniffer, especially when we find a suspicious worm or backdoor activity, we get only useful information like MAC addresses, IP addresses and also the port number in transport layer. The analyzer may not even know which application layer protocol is used, even it tells, we still need to figure out which application or process is using this application layer protocol. Is there any method that we can find out the original application or process using that TCP or UDP port? If you are conducting an on-site analysis, Capsa can easily help find out which process is using what port.
Let’s see how.

Find out Port Number

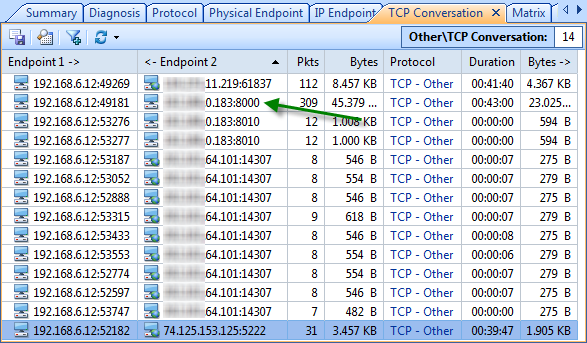
For example, I spot in Capsa Free the following TCP connection suspicious, which constantly communicates to IP: xx.xx.0.183, on port 8000. So I’m going to look up the process name using this port.
find_port

Find Process ID (PID)

At once I evoke Command Prompt, and entered the following string and hit enter.

netstat –aon | findstr :8000

Explanation:

-a: list all active connections and their ports. –o: show process IDs. –n: display the port numbers numerically.

| findstr :8000: display only the items with string :8000 (findstr means find string). Don’t forget the pipe symbol | at the beginning.

Let’s see what we get.

find_pid

We can read in this case 3968 is the PID, and the source IP address and the target address is the same as the first figure.

Find Process/Application

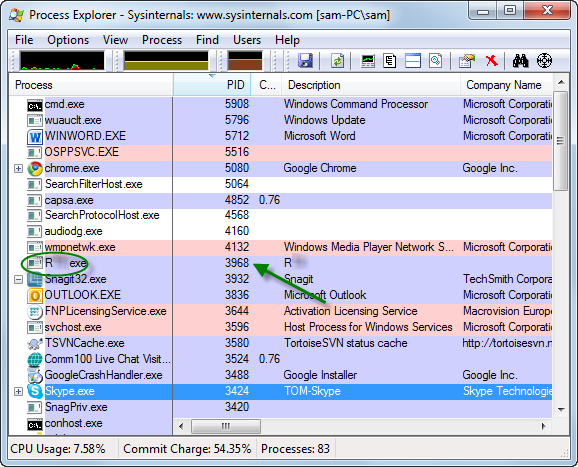
Next we’ll switch to another tool Process Explorer (a free tool that you can get from: http://technet.microsoft.com/en-us/sysinternals/bb896653) immediately. And we can easily find out the process or application of this PID: 3968.
process_explorer

I’m sure it’s an instant messenger used internal in my office and it’s safe. You can also try to find this PID in Windows Task Manager if you don’t have Process Explorer installed.

However task Manager will not provide as much information as Process Explorer. And command prompt is quite handy for geeks.

tasklist | findstr 3968

This command will list only the task items with string 3968. Please refer to previous command if you not sure about | findstr parameter.

Kill Process/Application

So next, you may want to kill a process when you find it’s malicious and want to end it at once? If you are with Process Explorer, you just right-click on a process item and choose Kill Process (Press Del button for short) to kill that process (you can do the same in Task Manager). Again, you may run the following in Command Prompt:

taskkill /F /PID 3968

Explanation:

/F means force to kill the process. And I suppose you understand PID so far.

Now we successfully detect and target the suspicious process with the specific port number, no matter UDP or TCP. And of course this procedure is reversible, you can find out the port number from the process’s PID.

How to save monitored email contents with Capsa 7.3

2010年11月4日 没有评论

Colasoft just released a major upgrade of Capsa Network Analyzer a few days ago and we notice that the Security Analysis Profile is the most important new feature in Capsa 7.3 which helps users to locate and troubleshoot network issues and attacks like ARP attack, DoS attack and port scanning. Besides that, the feature of email auto-saving that users appreciated in previous versions had some adjustments. So, this article is aims to teach you how to save monitored email contents.

In Capsa Network Analyzer 7.3, if you need to save a copy of the monitored email to your hard disk, you should do the following:

Step 1. Enable Log Output

a. Go to the Start Page and click the Set Data Storage link on the right panel.
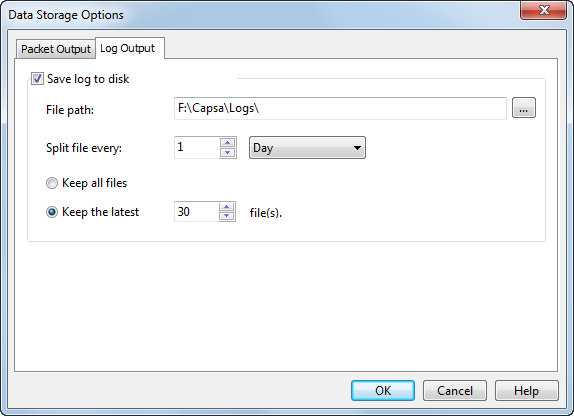
b. You see the Data Storage Options dialog box, highlight the Log Output tab and then check the Save log to disk checkbox.
c. Finish the settings of choosing file folder and setting up the rules to save logs in different files.

log_output

Step 2. Enable Email Copy

a. Double-click the analysis profile you want to use and enable the Email analysis module. Probably you’ll use Full Analysis or Email Analysis because they initially enabled the Email analysis module. This step is very important and if you don’t enable Email analysis module, Capsa will not analyze and capture any email.
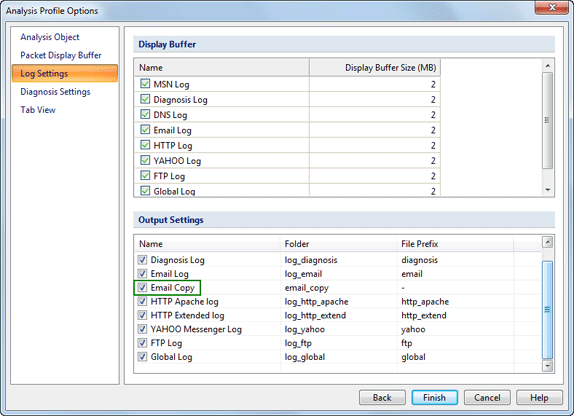
b. Click Next and click Log Settings. You will focus on the Output Settings and make sure the Email Copy item is checked.
log_output_settings

Set up as the instructions above, Capsa will save all captured inbound and outbound email contents to your hard disk. Why did you make these adjustments, you may ask? This is because users of the earlier versions might be toggled among different analysis profiles and they often forget to enable log output on different profiles. That means in previous versions, every analysis profile has a switch of email auto-saving. Therefore this time we can see the switch is made globally. Once you enabled log output, the logs will be saved to your hard disk no matter which analysis profile you choose.

It’s also notable that this time Capsa is able to output logs in multiple files as the rules you set. For example, you can set to save logs to a separate file every 10 minutes. It makes it easy for you to find useful logs in time-split small files rather than in a big log file.

I’m sure you already know how to save emails with Capsa 7.3 after reading through this article.

How to monitor FBHOLE worm with Capsa network analyzer

2010年6月9日 1 条评论

We provide some tips on monitorring FBHOLE worm. In this article, we specificlly provide a step by step guide on how to build a fileter and monitor FBHOLE worm with Capsa network analyzer.

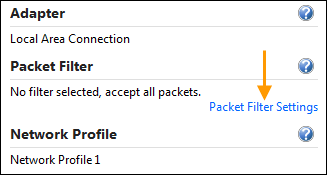
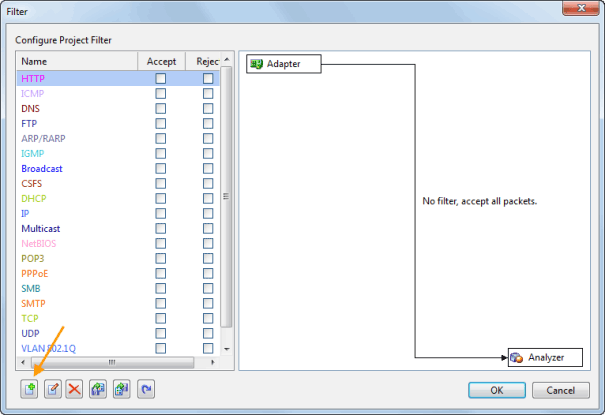
1. On the Start Page, click Packet Filter Settings link to open the Filter dialog box, which organizes all the filters.

packet_filter_settings_link

2. Click the Add button (on the bottom-left corner of the dialog box) to build a new filter.

new_filter

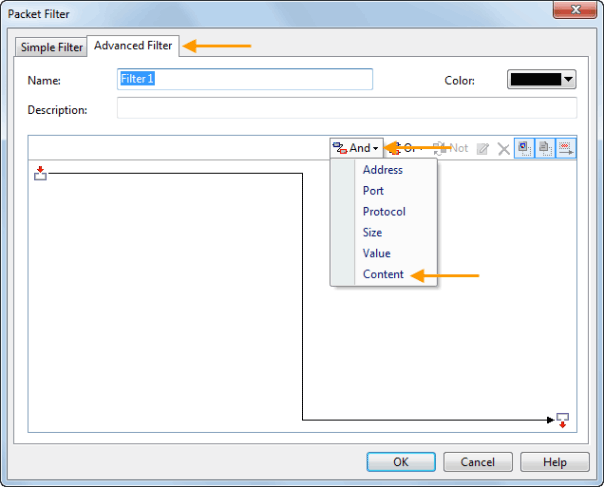
3.In the new window, choose Advanced Filter tab. And click the And icon. Choose Content from the context menu.

advanced_filter

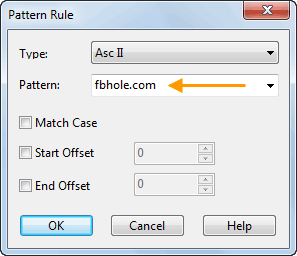
4. In the Pattern Rule window, just enter keyword: fbhole.com in the Pattern text box. Then click OK to close the window.

pattern

5. Click OK again to close the Packet Filter window.

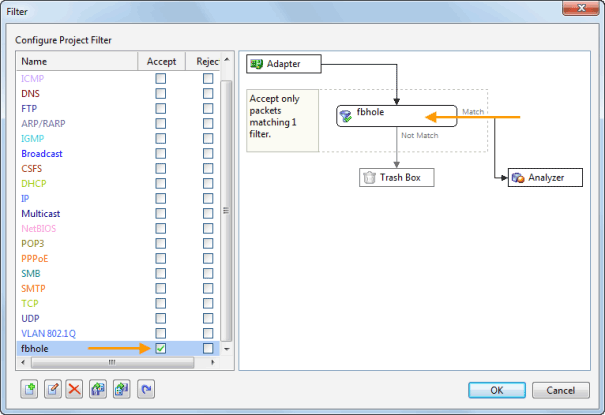
6. Check the Accept checkbox of the filter just built which enables the program only capture the packets containing keyword “fbhole.com”.

accept

7. Click OK and then start a capture.

8. If there is already a project running, you’d better stop it to build the filter and restart the capture. To build a filter in a running project: click the Filter button on the Ribbon. You will also see the Filter dialog box as well.

filter_ribbon

How to find the top bandwidth users with Capsa?

2010年4月12日 2 条评论

Sometimes when our network is going abnormal, we need to find out and check the top bandwidth users for clues, such as BitTorrent downloading, online video, worm activities, and so on. With Capsa 7, you don’t need to do any settings or configurations. All you need to do is to run the program, and get the statistic results with a couple of clicks.

First, let’s start Capsa7.1, we’d better not set any filters, unless we are monitor a specific kind of traffic. Then, we just keep the program running.

1

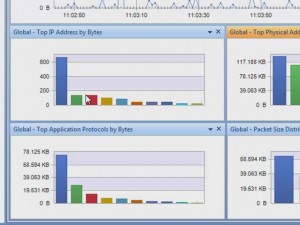
We first t come to the dashboard. By default, there’re two graphs in the dashboard, providing top talkers statistic results. They are Top physical address by bytes, and top IP address by bytes. By default, they display the top 10s. We can move pointer over a bar to see its address. In this network, the IP address, 192.168.5.24 (one ninety two, dot one sixty eight, dot five dot twenty four), consumes the biggest portion of bandwidth.

2

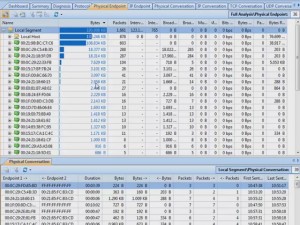
If we need detailed statistics of those nodes, we can come to the physical endpoint tab, or Ip endpoint tab. We can click the column header to order the list. Click this column to order by bytes. We can see who take the most traffic. We can see these highlighted bars; they help us recognize the column difference. Also we can click packets to see, who send out the most packets. From these statistics, we can get hints of anomalies, such as downloading and online video takes a lot of bandwidth, and some worm or attacks sends a great number of packets. The difference is we get MAC address in this tab, and IP address in another tab.

3

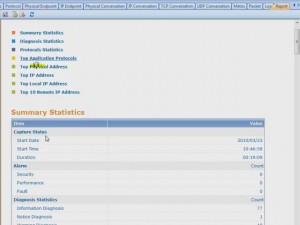
For some occasion, we need to generate a report of the top bandwidth users. Capsa 7.1 has the report function, let’s move on to the report tab. It provides five top statistic groups. Click an item; we see it’s an easy-to-understand table with information of IP address, traffic consumption percentage, bytes and packets.

4

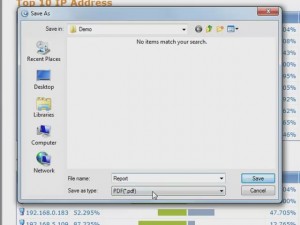
If we want to save the report, click this button, choose a folder, type in a file name, then we can choose to save the report in PDF or html. Click Save. Report saved, and we can see the webpage is the same in the report tab.

5

Watch the video tutorial at http://www.colasoft.com/download/top_10_network_traffic_hosts.php