存档

文章标签 ‘Colasoft’

Colasoft Enhances Capsa Network Analyzer with TCP Flow Analysis

2011年9月26日 没有评论

We are very excited to release the availability of Capsa Network Analyzer7.5. Except for the enhanced user interface, the biggest highlight of Capsa Network Analyzer7.5 is TCP flow analysis which makes it easier for network administrators to analyze application performance and pinpoint critical performance issues.

Capsa Network Analyzer 7.5 presents a comprehensive high-level overview of application health on your network. From TCP transaction analysis, you can easily access to more detailed information, including TCP server/client response time, delay, retransmissions, and further down to the server flow to observe the actual media content of the flow. “This unparalleled level of control and visibility speeds time to resolve application problems and minimize overall network downtime,” said Ocean Yu, Vice President at Colasoft.

In addition to MSN and Yahoo Messenger monitor, Capsa Network Analyzer 7.5 added ICQ monitor to meet the market demands. ICQ logs can be easily found at the log tab where detailed information is vividly displayed. Moreover, RADIUS protocol is supported as a new member in the more than 300 protocol analysis family.

Top Highlights of Capsa Network Analyzer 7.5:

1. Powerful TCP flow analysis for application performance optimization
2. Add ICQ monitor to analyze and log ICQ activities
3. Support RADIUS protocol analysis
4. Intuitive TCP transaction sequence diagram
5. Enhanced user interface & performance

Capsa 7.5 runs under Windows XP/2003/2008/Vista/7. A trial version is available for download.
Colasoft Announces the Launch of nChronos Retrospective Network Analysis Software

2011年5月31日 2 条评论

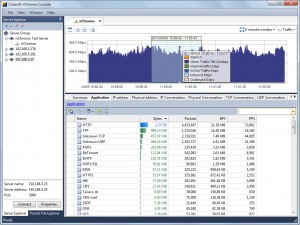
May 31, 2011, Colasoft, the leading provider of innovative network analysis solutions, today announces the launch of nChronos retrospective network analysis software, providing customers with great capabilities to troubleshoot high performance networks and pinpoint critical performance & application issues.

As a brand new retrospective product, nChronos’ release has poured fresh and great power to Colasoft Network Analysis Technology. It performs massive packet capturing and recording, efficient data mining and in-depth network traffic analysis to empower customers the capability of visualizing the overall enterprise network activities, drilling down to isolate performance issues and troubleshooting high-priority and critical network issues. Furthermore, it consists of servers and consoles to achieve expediently remote data capture, decoding and analysis for efficient network troubleshooting, application and device performance evaluation and optimization.

“With nChronos, IT professionals are able to view a specific window of time to troubleshoot network problems, benchmark the network performance, and audit network user activities with forensics from the historical network traffic”, said Eddie Gao, CTO of Colasoft, “Exclusively, nChronos provides scalable mass storage capacity varies from 1TB to unlimited storage for packets and statistics retrieval to meet the customizable network requirements”.

Features of nChronos retrospective network traffic software:

7×24 real-time packet capturing and recording for forensics analysis
Retrospectively analyze historical traffic of any time period
Baseline and visualized trends of network performance
Critical links monitoring & alerting
In-depth network traffic analysis to optimize performance
Efficient drill-down for traffic data-mining & index

An evaluation copy of nChronos retrospective network analysis software is available. Click here to request.

How to monitor FBHOLE worm with Capsa network analyzer

2010年6月9日 1 条评论

We provide some tips on monitorring FBHOLE worm. In this article, we specificlly provide a step by step guide on how to build a fileter and monitor FBHOLE worm with Capsa network analyzer.

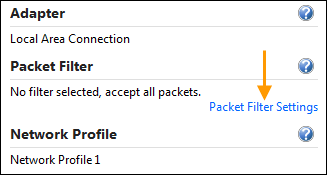
1. On the Start Page, click Packet Filter Settings link to open the Filter dialog box, which organizes all the filters.

packet_filter_settings_link

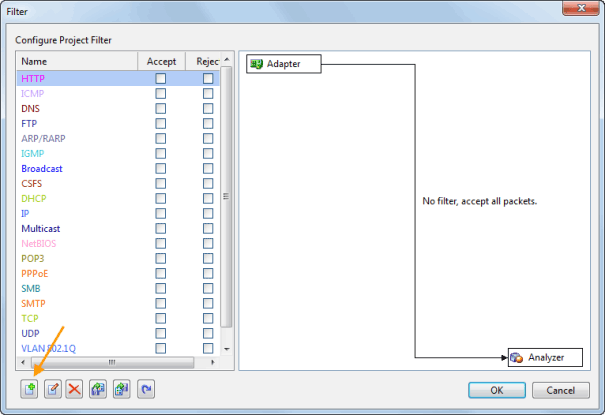
2. Click the Add button (on the bottom-left corner of the dialog box) to build a new filter.

new_filter

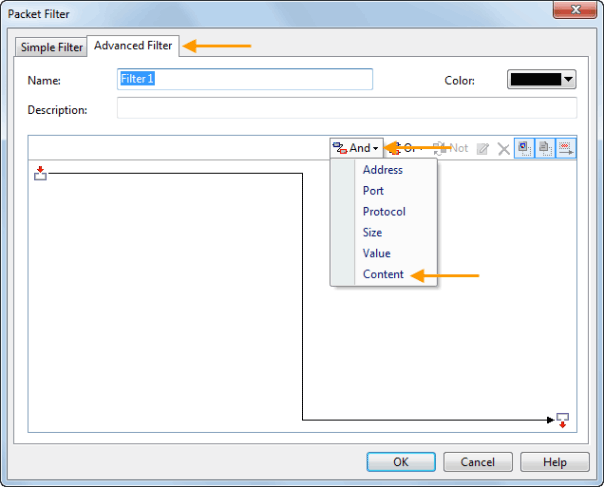
3.In the new window, choose Advanced Filter tab. And click the And icon. Choose Content from the context menu.

advanced_filter

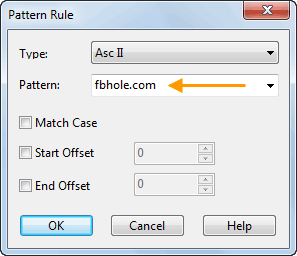
4. In the Pattern Rule window, just enter keyword: fbhole.com in the Pattern text box. Then click OK to close the window.

pattern

5. Click OK again to close the Packet Filter window.

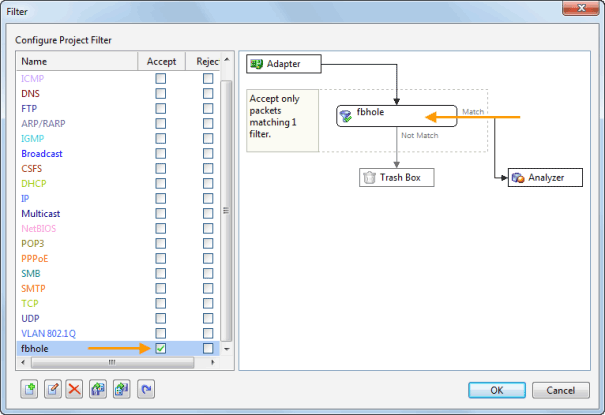
6. Check the Accept checkbox of the filter just built which enables the program only capture the packets containing keyword “fbhole.com”.

accept

7. Click OK and then start a capture.

8. If there is already a project running, you’d better stop it to build the filter and restart the capture. To build a filter in a running project: click the Filter button on the Ribbon. You will also see the Filter dialog box as well.

filter_ribbon

How to Detect MAC Flooding Attack in your LAN?

2010年4月6日 9 条评论

In a typical MAC flooding attack, a switch is flooded with packets, each containing different source MAC addresses. The switch records these addresses to its CAM table. When the table is full, the switch cannot look up the right destination port, but to broadcast out on all ports. A malicious user could then use a packet sniffer running in promiscuous mode to capture sensitive data from other computers, which would not be accessible were the switch operating normally.

How to detect if there’s a MAC flooding attack in the network? In this article, I will demonstrate to you with Colasoft Capsa Analyzer.

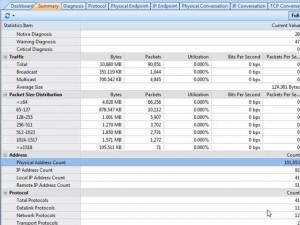
For detecting MAC flooding attack. Let’s start capture, we start the analysis from the SUMMARY TAB. All these statistics seem right. Except one when we come to the Physical address count. There are more than a hundred thousand MAC addresses discovered in this network. How could this small network have so many machines? Possibly, it is a mac flooding attack.

1

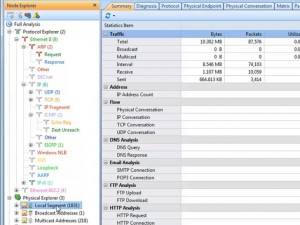
We need to check the addresses in the NOD EXPLORE. Open the physical explorer, and look this number; there are more than 1800 MAC addresses in local segment. It’s abnormal; there is no way that so many machines exist in this network. And apparently, these addresses are not real. We are sure that there are worm activities, or attacks in the network.

2

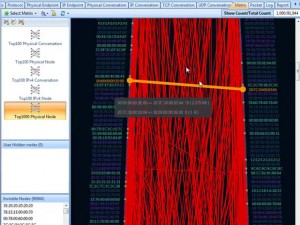
Let’s see how these nodes are communicating. Open the MATRIX TAB. And we choose Top 1000 physical node matrix type. We see this matrix, what a mess! There are so many nodes communicating, and according to the colors of the line, red means one way transmitting.

3

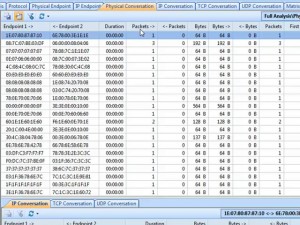
And we can go to the PHYSICAL CONVERSATION TAB to read that it’s true. Almost all nodes only send one packet out. Most packets are 64 bytes.
We know that all machines in our network are connected with a switch. This looks like a MAC flooding attack.

4

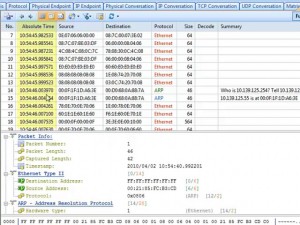
Still, to confirm our prediction, we need to see the original data of the packets they send out. Open the PACKET TAB. We see the delta time between packets is very small, which gives a great pressure to the switch. Almost all packets are 64 bytes. And let’s look at the original data in the packets. Almost all packets are randomly generated by padding same digits in the packets.

5

According to all these behaviors, and decoded information from packets, we are pretty sure that there is MAC flooding in this network. But it’s hard to find the attacker’s address directly because all addresses are forged. However, we can cut some machines off the network to eliminate the innocent machines until we find the target one.
Watch the video tutorial of detecting MAC flooding attack is avaliable at Here!