存档

文章标签 ‘Capsa’

Download3k Review:Colasoft Capsa Professional 7.7.2–Comprehensive and Reliable Packets Sniffer

2014年2月13日 没有评论

Reviewed by Michael Black on  (version tested: 7.7.2)

Overview

Anyone working in the IT Industry could benefit from using Capsa Professional, this software is capable of tracking network activity to a very extensive degree. The list of available features goes on and on, with the main feature being detailed packet monitoring, and a tremendous amount of information regarding traffic on your network. Capsa also offers some really helpful guides for new users who aren’t familiar with this type of interface. Using this software can help you track down the root cause of a slow or unstable network, and also assist in fixing the problem.

Installation

You can download and install the 15 day trial of Capsa Professional for free, and it is only compatible with Windows. The trial is also limited in features, but you’ll still get the look and feel of the full program. No bundled software included, just a regular installation and you’re on your way.

Interface

Capsa Professional offers a large, scale-able interface, and is all around pretty easy to navigate once you become acquainted with the software. Most of the tools will open up in a new window, which ensures that your main screen never gets cluttered with different tabs. However, with this much information, it’s pretty much guaranteed to be overwhelming at first — unless you’re a seasoned network professional. In general, Colasoft did a great job organizing the extensive list of features, which is not an easy task.

Interface is a major issue with most suite-style network monitoring software, and it’s very refreshing to see something as well put together as Capsa.

Pros

Along with the aforementioned packet monitoring capabilities, intelligently organized UI, and the fact that it can narrow down network issues to help find the root cause of a problem, there’s plenty more. Capsa Professional can be used to scan all MAC addresses on your network, as well as grab their IPs, names, and information about the manufacturer. You can also monitor a specific network adapter, or multiple, such as your ethernet port, wfii adapter, or both.

The tutorials are fantastic as well, as mentioned above, and there are even specific guides such as “How to monitor Employee Website Visits”.

Cons

The program is stable, offers everything you’ll need in network monitoring, and there’s really nothing I can say that needs work at this point. Obviously the heavy price tag is a bit daunting, but considering this software is really only necessary in a large work environment, it’s nothing to complain about.

Alternatives

Also, Capsa even offers a free version, much more suited towards troubleshooting home network issues.

Conclusion

Troubleshooting network issues can be a major pain for any IT Technician, and I’ve personally been in that situation numerous times. Using Colasoft Capsa Professional will greatly reduce the time you spend trying to find the cause of these problems, and will help you get the issues resolved much quicker.

Requirements: P4 2.8G CPU, 2G RAM, Internet Explorer 6.0 or higher

From: download3k.com

Review:Taking Colasoft’s Capsa 7 Enterprise For a Spin

2013年12月31日 没有评论

Lee H.Badman, Wirednot, Dec. 28th, 2013

A few weeks back, I was invited by Colasoft to take a look at their Capsa 7 Enterpriseanalyzer. Having a little time off around the holidays, I finally got around to spending a couple of hours with the product. This hardly constitutes an in-depth review, but I can share some of the first impressions this interesting and powerful tool made on me during playtime.

I was vaguely familiar with Colasoft, having looked at some of their rather nifty freebies (like a multi-host ping tool) in the past. Wanting to get oriented before digging in, I popped in on the website to see what the promise of Capsa 7 Enterprise amounts to. Lifted from Colasoft’spages:

Key Features of Capsa Enterprise:

  • Real-time packet capture as well as the ability to save data transmitted over local networks, including wired network and wireless network like802.11a/b/g/n;
  • Identify and analyze more than 500 network protocols, as well as network applications based on the protocol analysis;
  • Identify “Top Talkers” by monitoring network bandwidth and usage by capturing data packets transmitted over the network and providing summary and decoding information about these packets;
  • Overview Dashboard allows you to view network statistics at a single glance, allowing for easy interpretation of network utilization data;
  • Monitor and save Internet e-mail and instant messaging traffic, helping identify security and confidential data handling violations;
  • Diagnose and pinpoint network problems in seconds by detecting and locating suspicious hosts;
  • Ability to Map the traffic, IP address, and MAC of each host on the network, allowing for easy identification of each host and the traffic that passes through each;
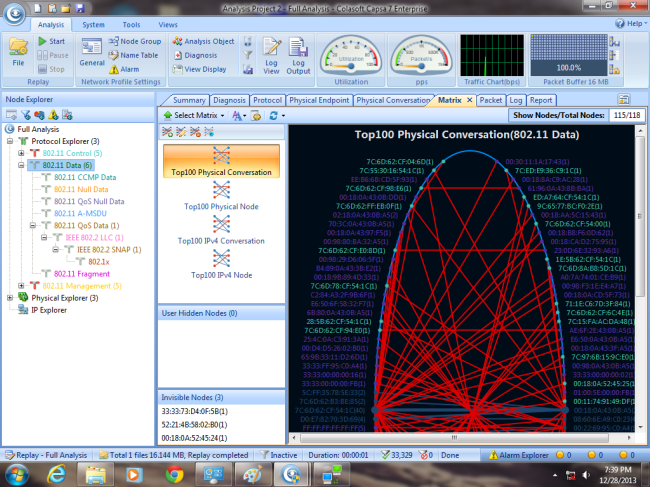
  • Visualize the entire network in an ellipse that shows the connections and traffic between each host.

It’s a pretty ambitious feature set, for a $995 price tag. (“Enterprise” differs from “Professional” in that Professional doesn’t do WLAN.) Capsa is only available for Windows (all versions), and this is a laptop analysis tool rather than a datacenter-racked super-sleuther. Also- WLAN support includes up to 802.11n, but not .11ac yet.

That’s the intro, but how does the product actually perform? I’ll admit to being impressed.

Image

Though I know my way around plenty of CLIs, I’m a UI guy- I hate sucky, confusing, ill-laid out interfaces. Colasoft passes my muster in this regard- Capsa 7 packs a surprising amount of analysis info into a peppy and nicely designed dashboard. Having little Ethernet in my home these days and not wanting to get up off my duff to set up a wired test scenario (it’s the holiday break, after all) I aimed most of my tire-kicking at my home WLAN environment (currently a mix of Aerohive and Meraki). As with any analysis tool, you start by selecting your adapter, and in this case a WLAN channel and one or more SSIDs, and off you go- no AirPcap needed or any sort of special drivers (I tested it with a number of adapters, all did well).

You get variety of analysis profiles to pick from (Full, Traffic Monitoring, Security, HTTP, Email, DNS, FTP, Instant Messaging), and deep views into the gory details of 802.11/802.3 packets as you would with any competing tool. You also get just a nice range of different views that feel AirMagnet-y (or WildPackets-y) at times, but what you don’t get is any of the spectrum type channel plots that MetaGeek gives. Short of that, Capsa 7 is pretty comprehensive.

My “testing” amounted to generating a bunch of nothing-special network traffic both locally and across the Internet, and then drilling into it looking for anyplace I might want to go for analysis that Capsa fell short on. There just wasn’t any.

I am intrigued enough to play further, and my fully-functional eval copy will also get turned loose on my big WLAN when I get back to work to see how it does in the presence of an enterprise-grade 802.1x Wi-FI environment with a ridiculous order of magnitude more clients than I have at home. If there is anything good or bad to add, I’ll come back and amend this post.

Meanwhile, Colasoft does make Capsa 7 available for free 15-day trials.

If you’re in the market for a decent all-in-one wired/wireless analyzer, AND you don’t need 11ac support, AND you run Windows, you might want to have a look at Capsa 7 Enterprise.


Among 10 Free Network Analysis Tools,Capsa Free Ranked First

2013年12月31日 没有评论

http://www.networkcomputing.com/data-networking-management/10-free-network-analysis-tools/240163757?queryText=capsa

The article was written by Ericka Chickowski .She is an award-winning freelance writer, Ericka Chickowski specializes in coverage of information technology and business innovation. She has focused on information security for the better part of a decade and regularly writes about the security industry as a contributor to Dark Reading. Chickowski’s perspectives on business and technology have also appeared in dozens of trade and consumer magazines, includingChannel Insider, Consumers Digest,  Entrepreneur,  InformationWeek, Network Computing and SC Magazine.(Information from http://www.networkcomputing.com)

Ericka Chickowski  recommended 10 free network analysis tools in her article,the first one is Capsa Free.

This is how Ericka Chickowski describes Capsa Free.

Capsa Free is an network analyzer designed for monitoring, troubleshooting and analysis, Capsa Freefrom Colasoft provides the capability to identify and monitor more than 300 different protocols. Users can record network profiles, create customizable reports and set customizable alarm trigger combinations. Additionally, Capsa offers MSN and Yahoo Messenger monitoring statistics, email monitoring and auto-saving of email content and an easy-to-use TCP timing sequence chart.” (Actually Capsa can  identify and monitor more than 400 different protocols now.)

Thanks Ericka, Thanks all the people who like Capsa.


Configuring SPAN On Cisco Catalyst Switches – Monitor & Capture Network Traffic/Packets

2013年1月29日 没有评论

Source: http://www.firewall.cx/cisco-technical-knowledgebase/cisco-switches/940-cisco-switches-span-monitoring.html

Being able to monitor your network traffic is essential when it comes to troubleshooting problems, performing a security audit, or even casually checking your network for suspicious traffic.

Back in the old days, whenever there was a need to monitor or capture network traffic, a hub would be introduced somewhere in the network link and thanks to the hub’s inefficient design, it would copy all packets incoming from one port, out to all the rest of the ports, making it very easy to monitor network traffic. Those interested on hub fundamentals can read our Hubs & Repeaters article.

Of course switches work on an entirely different principle and do not replicate unicast packets out every port on the switch, but keep them isolated unless it’s a broadcast or multicast.

Thankfully, monitoring network traffic on Cisco Catalyst switches is a straight forward process, and does not require the presence of a hub. The Cisco method is called Switched Port Analyser also known as  SPAN.

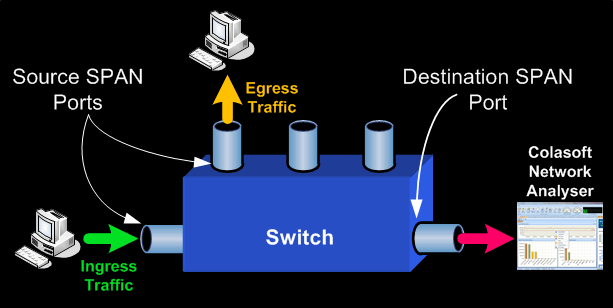
Understanding SPAN Terminology

  • Ingress Traffic: Traffic that enters the switch
  • Egress Traffic: Traffic that leaves the switch
  • Source (SPAN) port: A port that is monitored
  • Source (SPAN) VLAN: A VLAN whose traffic is monitored
  • Destination (SPAN) port: A port that monitors source ports. This is usually where a network analyser is connected to.
  • Remote SPAN (RSPAN): When Source ports are not located on the same switch as the Destination port. RSPAN is an advanced feature that requires a special VLAN to carry the monitored traffic and is not supported by all switches. RSPAN explanation and configuration will be covered on another article.
cisco-switches-span-1

The network diagram above helps us understand the terminology and implementation of SPAN.

Source SPAN ports are monitored for received (RX), transmitted (TX) or bidirectional (both) traffic.  Traffic entering or exiting the Source SPAN ports are mirrored to the Destination SPAN port. Typically, you would connect a PC with a network analyser (we trust and use Colasoft’s Capsa Enterprise) on the Destination SPAN port, and configure it to capture and analyse the traffic.

The amount of information you can obtain from a SPAN session really depends on how well the captured data can be interpreted and understood.  Tools such as Capsa Enterprise will not only show the captured packets, but automatically diagnose problems such as TCP retransmissions, DNS failures, slow TCP responses, ICMP redirect messages and much more. These capabilities help any engineer quickly locate network problems which otherwise could not be easily found.

Basic Characteristics and Limitations of Source Port

A source port has the following characteristics:

  • It can be any port type, such as EtherChannel, Fast Ethernet, Gigabit Ethernet, and so forth.
  • It can be monitored in multiple SPAN sessions.
  • It cannot be a destination port (that’s where the packet analyser connects to)
  • Each source port can be configured with a direction (ingress, egress, or both) to monitor. For EtherChannel sources, the monitored direction applies to all physical ports in the group.
  • Source ports can be in the same or different VLANs.
  • For VLAN SPAN sources, all active ports in the source VLAN are included as source ports.

Basic Characteristics and Limitations of Destination Port

Each SPAN session must have a destination port that receives a copy of the traffic from the source ports and VLANs.

A destination port has these characteristics:

  • A destination port must reside on the same switch as the source port (for a local SPAN session).
  • A destination port can be any Ethernet physical port.
  • A destination port can participate in only one SPAN session at a time.
  • A destination port in one SPAN session cannot be a destination port for a second SPAN session.
  • A destination port cannot be a source port.
  • A destination port cannot be an EtherChannel group.

Limitations of SPAN on Cisco Catalyst Models

Following are the limitations of SPAN on various Cisco Catalyst switches:

  • Cisco Catalyst 2950 switches are able only to have one SPAN session active at a time and can monitor source ports. These switches cannot monitor VLAN source.
  • Cisco Catalyst switches can forward traffic on a destination SPAN port in Cisco IOS 12.1(13)EA1 and later
  • Cisco Catalyst 3550, 3560 and 3750 switches can support up to two SPAN sessions at a time and can monitor source ports as well as VLANs
  • The Catalyst 2970, 3560, and 3750 Switches do not require the configuration of a reflector port when you configure an RSPAN session.
  • The Catalyst 3750 Switches support session configuration with the use of source and destination ports that reside on any of the switch stack members.
  • Only one destination port is allowed per SPAN session, and the same port cannot be a destination port for multiple SPAN sessions. Therefore, you cannot have two SPAN sessions that use the same destination port.


Configuring SPAN On Cisco Catalyst Switches

Our test-bed was a Cisco Catalyst 3550 Layer 3 switch, however the commands used are fully supported on all Cisco Catalyst 2940, 2950, 2955, 2960, 2970, 3550, 3560, 3560−E, 3750, 3750−E and 4507R Series Switches.

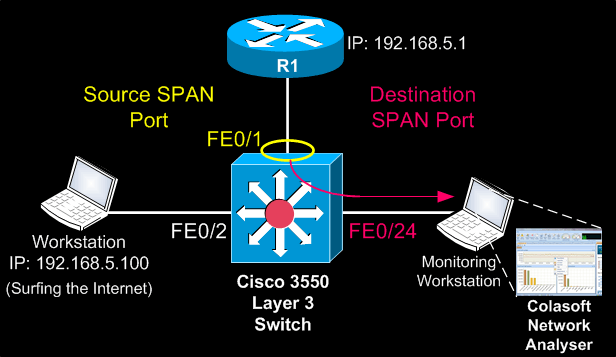
The diagram below represents a typical network setup where there is a need to monitor traffic entering (Ingress) and exiting (Egress) the port to which the router connects to (FE0/1). This strategically selected port essentially monitors all traffic entering and exiting our network.
cisco-switches-span-2

Since router R1 connects to the 3550 Catalyst switch on port FE0/1, this port is configured as the Source SPAN port.  Traffic copied from FE0/1 is to be mirrored out FE0/24 where our monitoring workstation is waiting to capture the traffic.

Because serious network procedures require serious tools, we opted to work with Colasoft’s Capsa Enterprise edition, our favourite network analyser. With Caspa Enterprise, we were able to capture all packets at full network speed and easily identify TCP sessions and data flows we were interested in. If you haven’t tried Capsa Enterprise yet, we would highly recommend you do by visiting Colasoft’s website and downloading a copy.

Once we got our network analyser setup and running, the first step is to configure FastEthernet 0/1 as a source SPAN port:

Catalyst-3550(config)# monitor session 1 source interface fastethernet 0/1

Next, configure FastEthernet 0/24 as the destination SPAN port:

Catalyst-3550(config)# monitor session 1 destination interface fastethernet 0/24

After entering both commands, we noticed our destination’s SPAN port LED (FE0/24) begun flashing in synchronisation with that ofFE0/1’s LED – an expected behaviour considering all FE0/1 packets were being copied to FE0/24.

Confirming the monitoring session and operation requires one simple command, show monitor session 1:

Catalyst-3550#  show monitor session 1

Session 1

———

Type                  : Local Session

Source Ports      :

Both              : Fa0/1

Destination Ports: Fa0/24

Encapsulation : Native

Ingress: Disabled

To display the detailed information from a saved version of the monitor configuration for a specific session, issue the show monitor session 1 detailcommand:

Catalyst-3550# show monitor session 1 detail

Session 1

———

Type              : Local Session

Source Ports      :

RX Only         : None

TX Only         : None

Both              : Fa0/1

Source VLANs    :

RX Only       : None

TX Only       : None

Both            : None

Source RSPAN VLAN : None

Destination Ports      : Fa0/24

Encapsulation       : Native

Ingress:         Disabled

Reflector Port           : None

Filter VLANs              : None

Dest RSPAN VLAN    : None

Notice how the Source Ports section shows Fa0/1 for the row named Both . This means that we are monitoring both RX & TX packets for Fa0/1, while the Destination Port is set to Fa0/24.

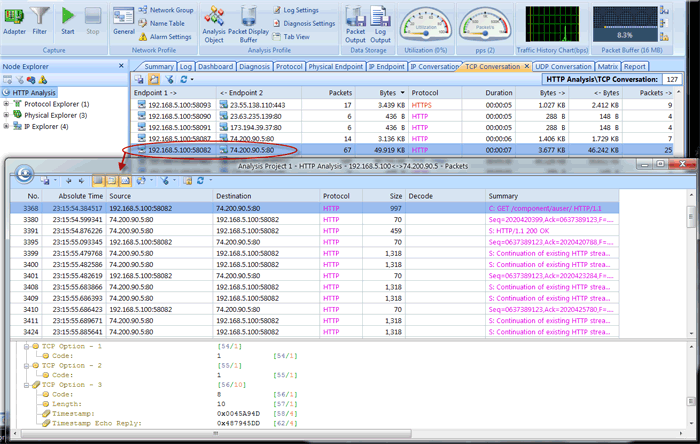
Turning to our Capsa Enterprise network analyser, thanks to its predefined filters, we were able to catch packets to and from the worksation monitored:
cisco-switches-span-3

This completes our discussion on SPAN configuration and how to monitor/capture packets on a Cisco Catalyst switch.  Upcoming articles will cover RSPAN and more advanced packet capturing techniques using dedicated VLANs for captured traffic and other complex scenarios.

 

分类: Articles 标签: , , ,

How to baseline network throughput and performance

2012年5月10日 1 条评论

What is network baseline?

Do you know what your normal network throughput volume is, what types of traffic are most used in your network? If you can’t answer these questions then you should baseline your network. Network baseline is very important to network management because the data will tell you what it’s like when everything goes all right.

To baseline your network, you need software or hardware to listen on your network or a particular device. Both Colasoft nChronos and Capsa can be used to accomplish this task. Both of them are used to listen into packet data of a wire and generate all kinds of statistics on the network. To baseline a network, you need to use them to monitor the network traffic long enough, because a wider time span presents a more real picture of network traffic pattern. The use of network baseline is listed as follows:

• Understand healthy network pattern and traffic trends.

• Evaluate network management policies compliance.

• Understand how the network resources are allocated.

• Accelerate to troubleshoot network issues, i.e. abnormal traffic and spam traffic, etc.

• Provide data on network and security management to support decision making.

• Provide history statistics on network upgrade.
阅读全文…

Thanksgiving Big Sale, Get Capsa at up to 40% off!

2011年11月21日 没有评论

Colasoft Thanksgiving big sale is now online! You can get Capsa at the most favorable price. Get coupons of up to 40% off now by clicking here!

How to Save Network Traffic to Hard Disk with Capsa?

2010年5月4日 6 条评论

Why do we need to preserve packets to local?

We all know that packets never lie. Saving packets to local means we have preservation of evidence on the network. One basic mission of a network analyzer is to capture network packets and save them to disk. To help us understand easily, we can compare the network analyzer as a monitoring camera. A monitoring camera continuously records image 24 hours a day and stores the movie for a certain time span. When we need to check what really happened in the past, we just replay the movie and we figure all out.
Capsa is like a network monitoring camera which is able to capture packets traveling in and out of the network and save the packets to a hard disk as packet files. Capsa listens to your order to save captured packets to a single file or multiple files by your splitting settings. My network traffic is very heavy, I don’t think my hard disk has enough space to hold those files, you may wonder. Under such circumstance, we can use filters to help us capture packets we are just interested in.

When do we need to save packets to local?

•Monitor network activities such as downloading, using IM, sending Email
•Recording traffics when the network admin not around. We can check last night’s network health status the second morning
•A network problem can’t be solved. We can save traffics to a packet file and turn to other technicians for help.

How to save packets to hard disk?

Finally let’s see how to save network packets to a hard disk. There are just a few simple steps of settings to accomplish this. But please make sure you have enough space to store those files on your hard disk.
1. Click the Packet Storage icon (figure below) on the Ribbon to open the Analysis Profile Options dialog box.
packet_storage_icon

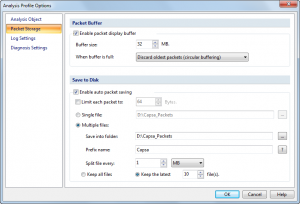
2. This is the Packet Storage page of the Analysis Profile Options. Check the Enable auto packet saving box in the Save to Disk group.
analysis_profile_options

Now, we will go through the options one by one:
2.1 Limit each packet to: If this box checked, only the first configured number of bytes of a packet will be saved. The excessive bytes will be discarded.
2.2 Single file: We should enable this option if we just need to store the packets to one packet file.
2.3 Multiple files: We should use this one when we need to capture packets for a long time. Capsa will split packets into multiple files according to the setting rules. It’s more useful for later analysis and traffic management. For example, we split packets by a time span of 24 hours. We only need to replay and analyze the packet file of that day which makes us focus on that traffic and make it easily to troubleshoot the network problems.
2.3.1 Save into folder: To choose a folder to store the packet files.
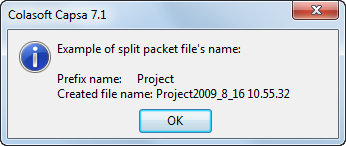
2.3.2 Prefix name: To set the file prefix for the packet files. We can click the ? button to see how the file names will be generated (figure below).
name_example

2.3.3 Split file every: Set the conditions for how to separate files. There are two conditions, by time or by file size. You can decide which one to choose by your certain network environment.
2.3.4 Keep all files/Keep the latest: If we choose to keep the latest number files, only the latest number of files will be kept and the older files will be deleted. To choose this option, we can save the space to store the packets files. Also the files exceed a long time are useless anymore.
When we need go back to pinpoint a network problem happened in the past, we just choose the interested packet files in the replay functionality of Capsa to reproduce the scenario of that time.

Detecting Trojan and Worm with Capsa Network Analyzer

2010年4月30日 9 条评论

Trojan and Worms are two major threats to network security. Do you know what exact is a Trojan horse? In Wikipedia, Trojan horses are designed to allow a hacker remote access to a target computer system. Once a Trojan horse has been installed on a target computer system, it is possible for a hacker to access it remotely and perform various operations.

Almost all Trojans and worms need an access to network, because they have to send data out to the hacker. Only the useful data are sent to the attacker the Trojan accomplishes its mission. So it should be a good solution that we start from the aspect of traffic analysis and protocol analysis technology. We are going to detect the Trojan horse and worm with the help of a –network analyzer-Colasoft Capsa. Capsa is an easy-to-use and intuitive network analyzer, which provides enough information to help check if there is any Trojan activities in our network. In this article I’m going to show you how to spot a Trojan or worm.

5 solutions to find the trace of a Trojan or worm in LAN network:

Solution 1: The Summary Tab

1
Concentrate on TCP packet summary. We should be alerted when TCP SYN Sent number is much larger than TCP SYN ACK Sent number. Generally the ratio of these two numbers approximately equals 1:1. Trojans and worms always send large amount of TCP SYN packet to the network and try to establish connections with other machines. When a connection established, they try to penetrate into the target machine.

Solution 2: IP Endpoint Tab

2
We can reorder the rows by clicking the column headers of the Packet Sent, Packet Received or IP conversation. Pay attention to the node with big statistics. They, however, might be BitTorrent downloading. But Trojans and worms definitely send out a large amount of packets.

Solution 3: The Log Tab

3
Focus on the DNS Log. We could make a list of target websites of Trojan horses by Google. For example, website like *****.3322.org. Furthermore, we can store the DNS log and analyze by using filters of the Trojans’ keywords.

Solution 4: Using Filters

04
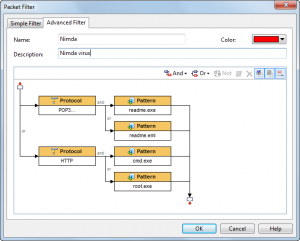
Build filters rules with patterns of some Trojans and worms. Until they send a packet out, we will get those Trojans’ and worms’ activities. This method has its drawback that it does nothing to a new Trojan or worm.

Solution 5: The TCP Conversation Tab & UDP Conversation Tab

5
6
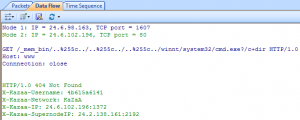
When Trojan or worm activities are found in our network, we can locate the machine’s IP address in the Node Explorer and then check its TCP Conversation or UDP Conversation. In TCP Conversation tab, we can read the reconstructed data of the communication in Data Flow sub tab, (the UDP Conversation is with the Data sub tab). Attentions have to be paid if the conversation is sending your system information.
Above are the featured tabs of Capsa network analyzer that we often use to detect network problems or bottlenecks. Moreover, we can spend some time to study what ports do the Trojans and worms like to use such as Executor:80, Ultors Trojan:1234. Then when we troubleshoot the network and make the analysis, we should pay attention to the node sending or receiving packets to and from these ports as well.

How to find the top bandwidth users with Capsa?

2010年4月12日 2 条评论

Sometimes when our network is going abnormal, we need to find out and check the top bandwidth users for clues, such as BitTorrent downloading, online video, worm activities, and so on. With Capsa 7, you don’t need to do any settings or configurations. All you need to do is to run the program, and get the statistic results with a couple of clicks.

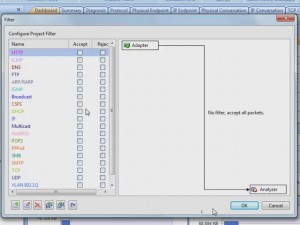
First, let’s start Capsa7.1, we’d better not set any filters, unless we are monitor a specific kind of traffic. Then, we just keep the program running.

1

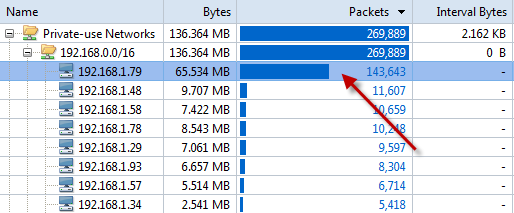
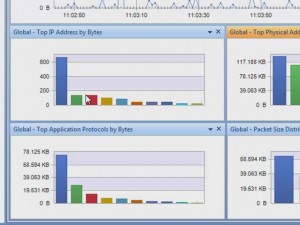
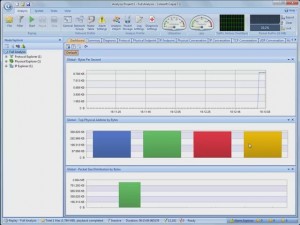
We first t come to the dashboard. By default, there’re two graphs in the dashboard, providing top talkers statistic results. They are Top physical address by bytes, and top IP address by bytes. By default, they display the top 10s. We can move pointer over a bar to see its address. In this network, the IP address, 192.168.5.24 (one ninety two, dot one sixty eight, dot five dot twenty four), consumes the biggest portion of bandwidth.

2

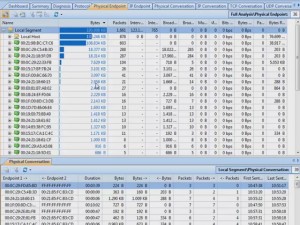
If we need detailed statistics of those nodes, we can come to the physical endpoint tab, or Ip endpoint tab. We can click the column header to order the list. Click this column to order by bytes. We can see who take the most traffic. We can see these highlighted bars; they help us recognize the column difference. Also we can click packets to see, who send out the most packets. From these statistics, we can get hints of anomalies, such as downloading and online video takes a lot of bandwidth, and some worm or attacks sends a great number of packets. The difference is we get MAC address in this tab, and IP address in another tab.

3

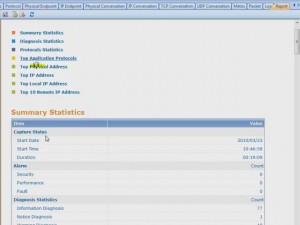
For some occasion, we need to generate a report of the top bandwidth users. Capsa 7.1 has the report function, let’s move on to the report tab. It provides five top statistic groups. Click an item; we see it’s an easy-to-understand table with information of IP address, traffic consumption percentage, bytes and packets.

4

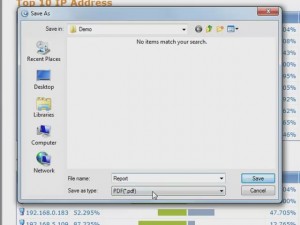
If we want to save the report, click this button, choose a folder, type in a file name, then we can choose to save the report in PDF or html. Click Save. Report saved, and we can see the webpage is the same in the report tab.

5

Watch the video tutorial at http://www.colasoft.com/download/top_10_network_traffic_hosts.php

How to Detect Possible Network Loops in Network?

2010年4月12日 23 条评论

Do you know what a network loop is? Have you ever had a network loop in your LAN? No matter you want it or not, a network loop in the LAN can bring down your whole network.

First, let’s see what a network loop is. What does a network loop do? A network loop is a network configuration there is more than one path between two computers or devices, which causes packets to be constantly repeated. This is due to the fact that a hub will blindly transmit everything it receives to all connections – other devices, such as switches and routers, might be able to reduce or eliminate this problem.

In this article, I’m going to show you how to detect the network loops in network with Capsa network analyzer 7.1?

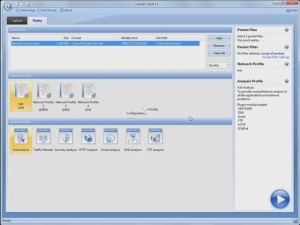
Let’s start Capsa, and then add in the packet file into the ready-to-replay list. Without any other settings, click this icon to start replay directly.
01
To detect network loops, first we come to the Dashboard tab. The graphs show that the traffic is not big. We can conclude that, no machine is keeping sending a large sum of packets, to block the bandwidth.
02
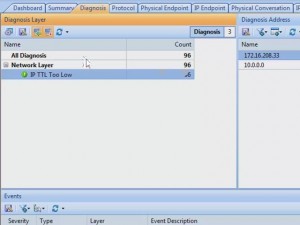
We can sure from the Protocol tab, that only ICMP is used in the traffic. However, in Diagnosis tab, there is one record, IP TTL too low, which means a packet has passed too many routers. That is a sign od network loop.
03
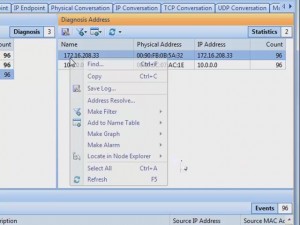
And we can see the anomaly happens at IP address, one seventy two, dot sixteen, dot two zero eight, dot thirty three. Let’s start from this address. Right-click on the address, and locate it.
04
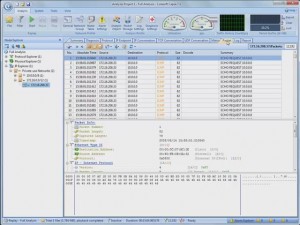
Then, go directly to the packet tab. We can see all the packets are ICMP packets. And we find the delta time between the packets is very small, and there are more than twelve thousand packets. This couldn’t be normal. Just a simple ping can’t produce so many packets, it looks like network loop a little bit.
05
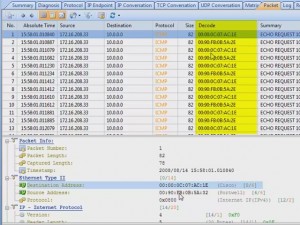
To confirm our guess, we should go down to the digits in the packets. We can compare the field information of different packets, by checking the fields in this pane. While we come to the identification field, we can see there are so many packets have the same identification number. We know that one ICMP packets has its own identification number, there’s no way that so many packets have the same number. Now we are much sure it’s a network loop. But to make sure of this, we need to see another important field, TTL value. Check the Time To Live field. We can see that the same ICMP packet loops around the router, and each time it passes the router, its TTL value is reduced by one. Until its TTL value comes to zero, it’s dropped by the router. Then another packet does it again.
06
This is the end of the story. Hope you already know how to find out network loop in network with network sniffer.
A video tutorial for troubleshooting network loops is avaliable at http://www.colasoft.com/download/arp_flood_arp_spoofing_arp_poisoning_attack_solution_with_capsa.php