存档

‘Uncategorized’ 分类的存档

Colasoft Announces Release of UPM v5.1

2016年8月23日 评论已被关闭

August 23, 2016– Colasoft, a leading provider of innovative and affordable network analysis solutions, announces the release of a new version of Colasoft UPM today. With the release of Colasoft UPM V5.1, just by a glance, users can know network running status, business running status and whether there are alarms triggered. In addition to business monitor and analysis, UPM 5.1 provides direct traffic monitor and analysis, and automatic network performance analysis. Besides new features, this release brings a lot of improvements, which will help users a lot on both network performance analysis and application performance analysis.

This new version of Colasoft UPM comes with a New Home Page, which could display the overall monitor status in real-time.Also, UPM Center provides a Probe Traffic Monitor page to display traffic trend charts for each probe. And a Probe Traffic Analysis page is add

分类: News & Events, Uncategorized 标签:

Colasoft Launched Unified Performance Management (UPM) Platform

2015年12月8日 没有评论

UPM v4.1 is capable of monitoring service quality of all aspects of a business network, quickly detecting and pinpointing problems affecting performance and stability of key business segments.

November 24th, 2015 – Colasoft LLC, a leading provider of innovative and affordable network analysis solutions, announces the release of a new business-oriented network performance management solution today. This new technology, known as Colasoft Unified Performance Management (UPM), partners best with our existing product, Colasoft nChronos. It collects all analysis data from nChronos, summarizes the data and displays the final results onto the dashboard.

Colasoft UPM is able to Visualize Business Running Status which enhances network management by providing a more business-oriented network management compared to most physical-oriented network management. This enables users to make proactive network analysis decisions based on each business system monitored. Operations staff have the capability to know the running quality of every single business segment at any time by displayed graphs and charts of the running status of business elements.

With the Quick Analysis of Business Performance Problem function, Colasoft UPM graphically displays the running status of all the applications which form a business network. With UPM graphs, users can view the application services, hosts and network paths supporting business systems. Colasoft UPM also supports graphic displays of key performance indexes and working status of all business elements, to help users quickly locate the root cause of the business system anomaly.

“In the fast growing network technology area, the combination of network and business systems are now intertwined.” said Brian K. Smith, Vice President of Colasoft LLC, “Today’s complex, hybrid networks require a more sophisticated technology to manage business networks. Colasoft UPM provides the solution that allows industry to deal with a rapidly growing network problem.”

About UPM

Colasoft Unified Performance Management (UPM) platform is a business-oriented network performance management solution. It is capable of monitoring service quality for all aspects of a business network and quickly detecting and pinpointing problems affecting performance and stability within key business segments. UPM will maximize business network management efficiency and network fault troubleshooting capability by providing business-centered network analysis supporting environment review, real-time performance monitoring and the quick detection of network faults. Colasoft UPM collects all real-time analysis data from Colasoft nChronos which is deployed across each network node providing operations staff with vivid and graphic views of every node in the business network.


分类: Uncategorized 标签:

Released: Capsa Network Analyzer 7.3.1

2010年10月20日 没有评论

We are so proud to announces the release of Capsa Network Analyzer 7.3.1. A brand-new analysis profile-Security Analysis Profile is added as well as more powerful Reporting Capabilities to enhance user experience.

The newly-designed Security Analysis Profile makes it more convenient and easier for users to find out potential security events with six new customer-requested Views. With Capsa 7.3.1, users can not only choose to open and close specific View, but also set up the sequences of Views to display. Report Logo Preview is available in this version which highly enhances Capsa’s reporting capabilities.

Roy Luo, CEO of Colasoft, states, “This new version addresses users’ requirement of security events analysis and also demonstrate our responsiveness. We only display security-related information in Diagnosis and Matrix Views before, this time we add six Views to broaden the scope of Capsa and provide better analysis experience. We’ll spare no efforts to provide extended capabilities to Capsa.”

New features of Capsa network analyzer 7.3.1:

Unique security analysis profile, analyzing DoS attack, ARP attack, and worm activities, etc
Flexible tab management panel of the main view
Data Storage option on the Start Page for packet and log save settings
Add Report Logo preview in Report Settings

New Views in Security Analysis Profiles:

ARP Attack: detects ARP attack activities and provides source MAC addresses
Worms: detects suspicious worm activities and provides details including source IP addresses
Dos Attacks: detects devices joining in a DoS attack to attack a remote site, and provides details on the devices
Dos Attacked: detects the devices under a DoS attack and provides details on targeted devices to cut off the attack
TCP Port Scan: detects suspicious TCP port scanning activities and details including attacker addresses
Suspicious Conversation: detects suspicious conversations of HTTP, FTP, SMTP and POP3, and provides details to figure out the problem

Capsa 7.3.1 runs under Windows XP/2003/Vista/7. A trial version is available for download at the company’s website: http://www.colasoft.com/

Detecting Trojan and Worm with Capsa Network Analyzer

2010年4月30日 9 条评论

Trojan and Worms are two major threats to network security. Do you know what exact is a Trojan horse? In Wikipedia, Trojan horses are designed to allow a hacker remote access to a target computer system. Once a Trojan horse has been installed on a target computer system, it is possible for a hacker to access it remotely and perform various operations.

Almost all Trojans and worms need an access to network, because they have to send data out to the hacker. Only the useful data are sent to the attacker the Trojan accomplishes its mission. So it should be a good solution that we start from the aspect of traffic analysis and protocol analysis technology. We are going to detect the Trojan horse and worm with the help of a –network analyzer-Colasoft Capsa. Capsa is an easy-to-use and intuitive network analyzer, which provides enough information to help check if there is any Trojan activities in our network. In this article I’m going to show you how to spot a Trojan or worm.

5 solutions to find the trace of a Trojan or worm in LAN network:

Solution 1: The Summary Tab

1
Concentrate on TCP packet summary. We should be alerted when TCP SYN Sent number is much larger than TCP SYN ACK Sent number. Generally the ratio of these two numbers approximately equals 1:1. Trojans and worms always send large amount of TCP SYN packet to the network and try to establish connections with other machines. When a connection established, they try to penetrate into the target machine.

Solution 2: IP Endpoint Tab
2
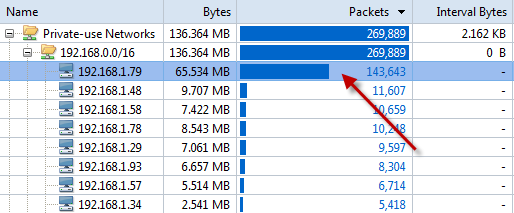
We can reorder the rows by clicking the column headers of the Packet Sent, Packet Received or IP conversation. Pay attention to the node with big statistics. They, however, might be BitTorrent downloading. But Trojans and worms definitely send out a large amount of packets.

Solution 3: The Log Tab

3
Focus on the DNS Log. We could make a list of target websites of Trojan horses by Google. For example, website like *****.3322.org. Furthermore, we can store the DNS log and analyze by using filters of the Trojans’ keywords.

Solution 4: Using Filters
04
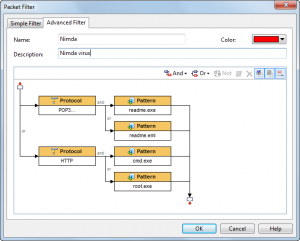
Build filters rules with patterns of some Trojans and worms. Until they send a packet out, we will get those Trojans’ and worms’ activities. This method has its drawback that it does nothing to a new Trojan or worm.

Solution 5: The TCP Conversation Tab & UDP Conversation Tab
5
6
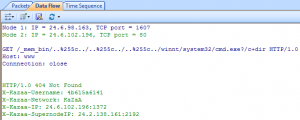
When Trojan or worm activities are found in our network, we can locate the machine’s IP address in the Node Explorer and then check its TCP Conversation or UDP Conversation. In TCP Conversation tab, we can read the reconstructed data of the communication in Data Flow sub tab, (the UDP Conversation is with the Data sub tab). Attentions have to be paid if the conversation is sending your system information.
Above are the featured tabs of Capsa network analyzer that we often use to detect network problems or bottlenecks. Moreover, we can spend some time to study what ports do the Trojans and worms like to use such as Executor:80, Ultors Trojan:1234. Then when we troubleshoot the network and make the analysis, we should pay attention to the node sending or receiving packets to and from these ports as well.