How to monitor HTTP traffic with Capsa Free
It is one of the essential duties for network administrators to monitor their network traffic like HTTP traffic to see what applications are running on the network. There are countless network traffic monitor tools in the market which make us dazzling and hard to choose. Except for those costly network monitors, Capsa Free is a totally network freeware which serves much better than common network monitors in monitoring network traffic like HTTP traffic.
This article is mainly to guide you through the steps of how to monitor HTTP traffic with Capsa Free.
Capsa Free is a must-have freeware network analyzer for network monitoring, network troubleshooting and network analysis. It provides users with great experience to learn how to monitor network activities, pinpoint network problems,enhance network security and so on. Moreover, Capsa Free is a perfect choice for students, teachers and computer geeks to learn protocols and networking technology knowledge.
Step 1: Download and install Capsa Free.
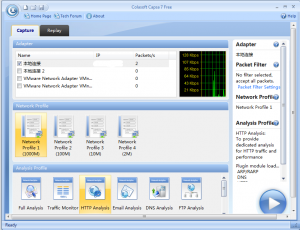
Step 2: Initiate Capsa Free, choosing HTTP Analysis as the analysis profile.
Step 3: View the HTTP traffic statistics in different tabs of Capsa Free.
a. Summary view: overall statistics of the capture.
b. Log view: webpage visiting records (anyone visited a website, logged here).
c. Dashboard view: important statistic data showing in visualized charts.
d. Diagnosis view: auto detected network errors.
e. Protocol view: the applications/protocols running on the network, traffic statistics.
f. Physical Endpoint & IP Endpoint views: traffic volume statistics of each node (by MAC address or IP address).
g. IP Conversation, TCP Conversation & UDP Conversation views: statistics on two communication nodes (from layer 3 to layer 4).
h. Matrix view: map of how hosts are communicated (MAC or IP addresses).
For the different tabs view, please click here.


Thanks for the steps. This will help me a lot,i thank you for saving my day 🙂 . This is such a big help to and to others too.