How to find the top bandwidth users with Capsa?
Sometimes when our network is going abnormal, we need to find out and check the top bandwidth users for clues, such as BitTorrent downloading, online video, worm activities, and so on. With Capsa 7, you don’t need to do any settings or configurations. All you need to do is to run the program, and get the statistic results with a couple of clicks.
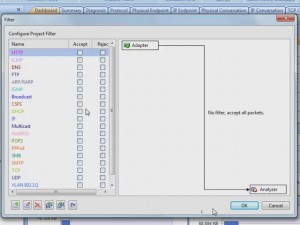
First, let’s start Capsa7.1, we’d better not set any filters, unless we are monitor a specific kind of traffic. Then, we just keep the program running.
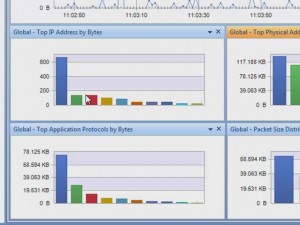
We first t come to the dashboard. By default, there’re two graphs in the dashboard, providing top talkers statistic results. They are Top physical address by bytes, and top IP address by bytes. By default, they display the top 10s. We can move pointer over a bar to see its address. In this network, the IP address, 192.168.5.24 (one ninety two, dot one sixty eight, dot five dot twenty four), consumes the biggest portion of bandwidth.
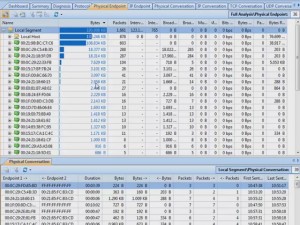
If we need detailed statistics of those nodes, we can come to the physical endpoint tab, or Ip endpoint tab. We can click the column header to order the list. Click this column to order by bytes. We can see who take the most traffic. We can see these highlighted bars; they help us recognize the column difference. Also we can click packets to see, who send out the most packets. From these statistics, we can get hints of anomalies, such as downloading and online video takes a lot of bandwidth, and some worm or attacks sends a great number of packets. The difference is we get MAC address in this tab, and IP address in another tab.
For some occasion, we need to generate a report of the top bandwidth users. Capsa 7.1 has the report function, let’s move on to the report tab. It provides five top statistic groups. Click an item; we see it’s an easy-to-understand table with information of IP address, traffic consumption percentage, bytes and packets.
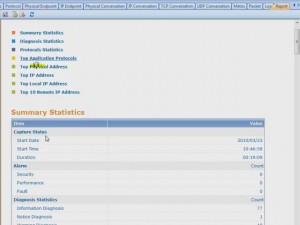
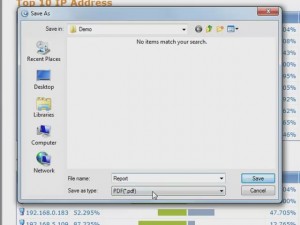
If we want to save the report, click this button, choose a folder, type in a file name, then we can choose to save the report in PDF or html. Click Save. Report saved, and we can see the webpage is the same in the report tab.
Watch the video tutorial at http://www.colasoft.com/download/top_10_network_traffic_hosts.php


as for me I control bandwidth with protemac meter
Everything is very open with a precise explanation of the issues.
It was definitely informative. Your website is very helpful.
Thanks for sharing!