By Shane Killen
I wanted to take the opportunity to do a review of the Colasoft Capsa program. I have been asked about this program often, and I think it is time I do a review. Everyone knows that I like this program and I personally use this network analyzer all the time in my consulting position. I love it and I have recommended this program on my blog and to customers of the company I work for. It has saved me time and money in diagnosing problems. And if I’m saving money, that means my customers are saving money. And everyone loves that!
A personal story:
Just to start this out, I want to tell you a quick, condensed story. I had a customer that called me up one morning. They told me that their network was “crawling” and they wanted to know if I knew of anything going on. I was at another client at the time, and all I knew to say at that point was that I could come over and take a look. They told me to hold off at the moment, and they would call me if you needed me. By the time 4PM came, I called that customer back to see what they had found. He told me that they still had the problem, and they wanted me to come on in and see if I could find the problem. I did just that. From the time I got there and started working on the problem, I set up a monitor session and connected my laptop up. Within 10 minutes, I told them what was the problem, what was causing the problem, and how it needed to be resolved. It was a device that had a NIC that started flooding the network. 180K packets per second (Capsa told me this). They went and disconnected the offending network cable for the device, and everything came back up without issue. Key NOTE: They had been working all day on this problem without resolution. I came in and within 10 minutes pointed out what the problem was, what was causing the problem, and what to do to fix it. I was able to do this with the Capsa network analyzer within 10 minutes of starting the troubleshooting. In this example, think of how much money and productivity was lost. The very next day, this customer bought Capsa.
Now, the review:
At first look, the Capsa dashboard has a very nice look and feel to it. The dashboard colors are easy on the eyes when looking at it for long periods time, which is important when needing to troubleshoot problems. You don’t need something hard to look at on top of using your brain to pinpoint issues, and Capsa is certainly easy on the eyes. See below for the first look.
The layout is also well designed. The tabs across the display make it easy to navigate to areas you need to get to. Its almost like the company had true technical engineers design the layout.
The first display I tend to look at and use is the default view. You can easily customize this to whatever it is you are looking for. Capsa puts out some displays for you by default. The defaults are good, but if you need more for what you are trying to accomplish, they made it very easy to add to this display if you want to. I personally modify it to what I like to see.
The “Summary” tab has very good statistical information in it. I personally dont use this tab much, but if you are looking for general statistical information about your network, this is a good place to view. I do know engineers that just want to take samplings on a network, and this is a good tab to view for just that. Things like Diagnosis statistics, Traffic statistics, Packet size Distribution statistics, Protocol statistics by OSI model, etc. Again, very good for taking statistical snapshots during timed intervals.
This next tab is really handy for doing network assessments. Its called the “Diagnose” tab, and this tab will tell you potential problems on the network that Capsa sees. Anything from delays, re-transmissions, SMTP server slow response, HTTP client error, etc. And when I say “etc”, I mean a lot of “etc”s. I use this all the time, and its very handy and helpful for the network engineer. Its handy because it even makes suggestions on what the actual problem resolution might be. That is a pretty cool feature.

The next tab shows a “Protocol” view of the network. This is an excellent view into what protocols are traversing your network. If you see a protocol in this display that you didn’t want on the network, this is a great place to see it quickly. Easy to see and right in front of your eyes without the need to sift through traffic or selecting a column view and then finding the protocol. Its just right in front of you with ease to see. This is very helpful when in a hurry to hunt down what you don’t want on the network, as far as protocol view is concerned. I have had plenty of times when trying to see what protocol is running on a network, just to know for sure what is there and what is not there. And when Im doing a deep inspection of a network, this is definitely one view I look at.
The “Physical Endpoint” tab gives you a view into the layer 2 and layer 3 view into the network for statistics. I personally don’t use this view much. However, I do see the benefit of this tab. You can find problems by either MAC address or IP address, like a malfunctioning NIC. This is a good statistical view of that. I personally will see it in the default view, because Ill customize the view there to see such things. But, this is also a great place for that sort of detail. One thing I really like about this view is that you can see the actual packets if you choose to. Just like what you would see in a wireshark packet capture. This is a great feature.
The “IP Endpoint” is a layer 3 view only into this view. Its very similar to the “Physical Endpoint” tab, with the same features for the most part. This is mostly a statistical view. Again, you can see the actual packet here if you want to see it, just like in wireshark. I have used this screen to find packets from a particular IP address, so that I can use the packet view before. This is very handy and easy to find what you are looking for if you are looking for a particular IP address. From the “offender”, you can view all you want as far as raw packets go. I personally like this and have used this often in the past.
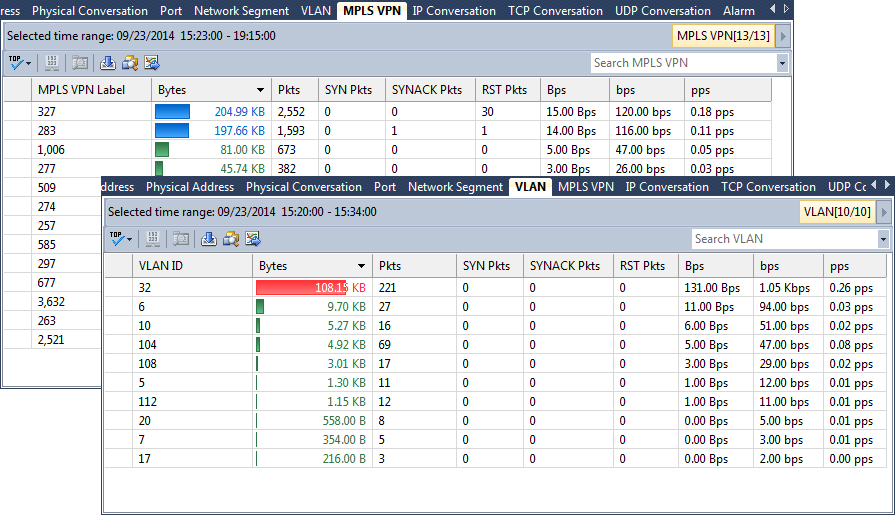
The “Physical Conversation” and “IP conversation” tabs has some important information for troubleshooting delays, etc. I personally have used this tab a lot, especially when looking for delays in traffic to find out what is actually happening. There is a lot of good information in these tab views.
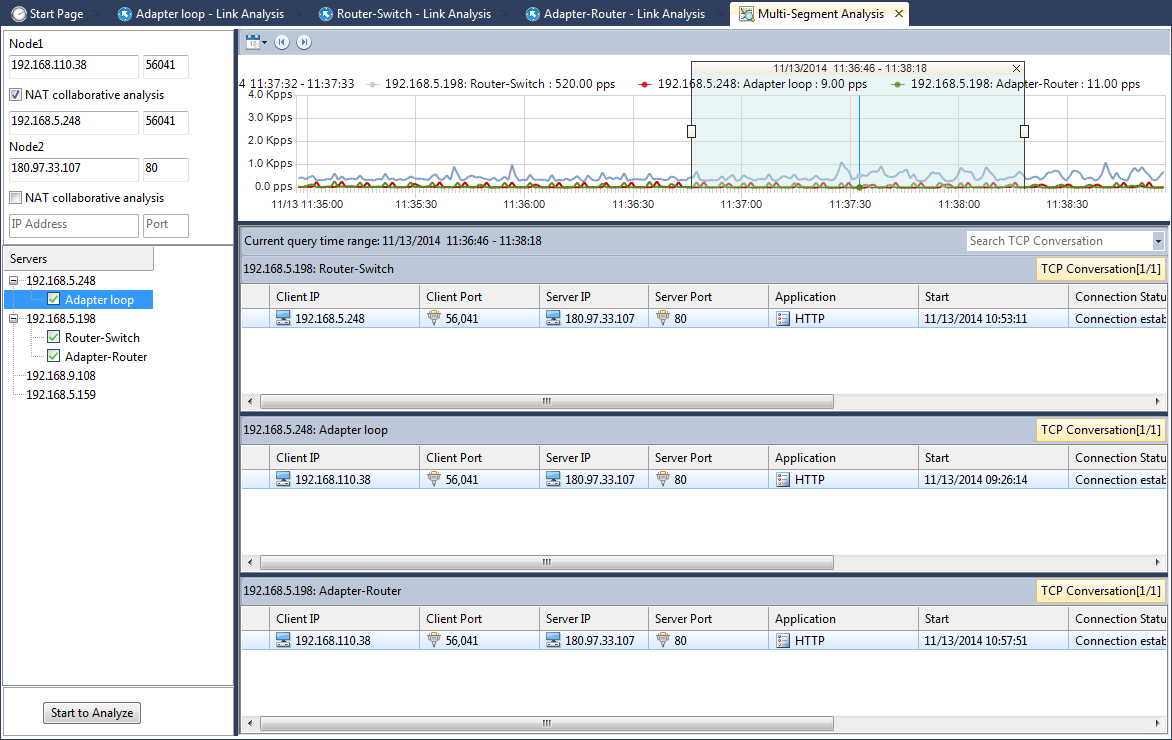
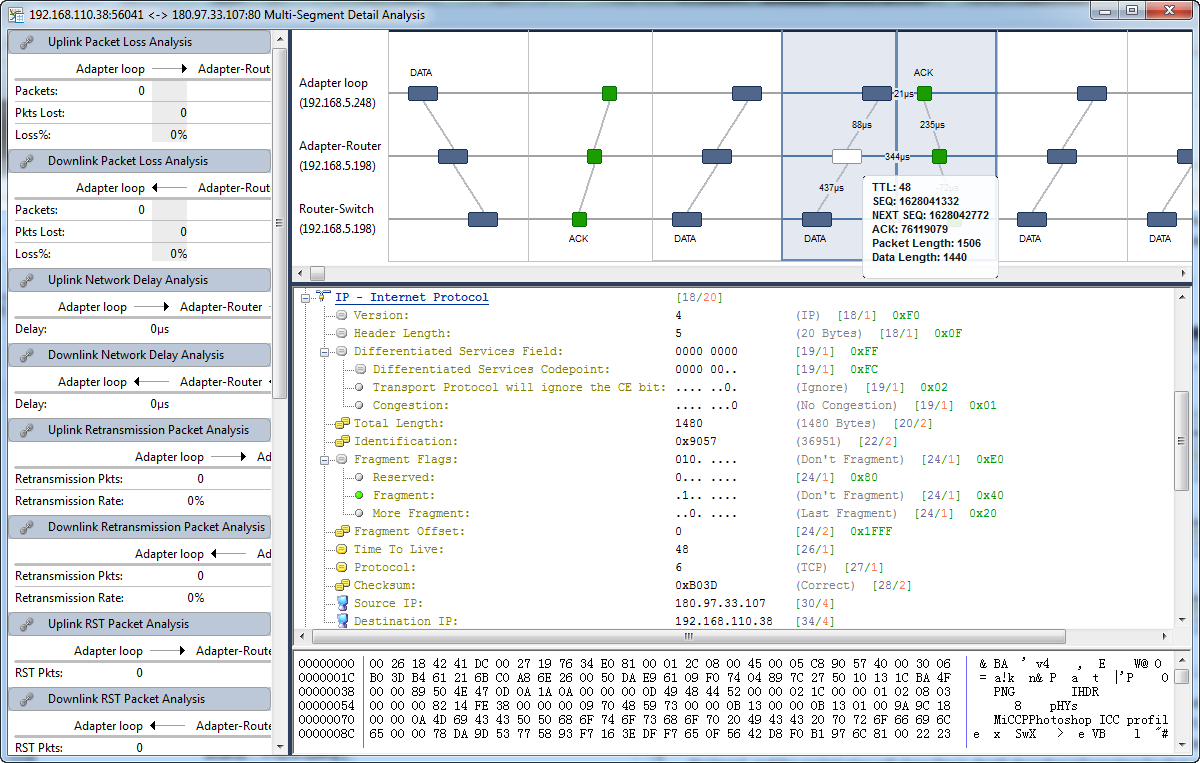
The “TCP Conversation” view is an excellent view for seeing delays, etc. In application type delays, you can easily prove where delta delays are when everyone is pointing at the network as fault. I have used this many times to prove application delays, and where the network was fine. This view makes it very easy to see these types of delays with transaction sequence diagrams, along with seeing the actual packet if you want to (which I do). Again, it just makes it easy. See below for a screenshot.
The “UDP Conversation” view is similar, with the exception of a data flow view. After all, its UDP. I personally dont utilize this tab much. Although, I do see the value in seeing the conversations between devices.
There is now a new section called “VoIP Call” tab. I have experimented with this and I do like this tab. It will show you the calls made via SIP, the status of the calls, duration, invite time, etc. It even has a “translatorX” like view if you are a visual person and want to see the call setup steps that each call has taken. This is especially helpful when troubleshooting failed SIP calls. This is a welcomed addition to the Capsa package. With that said, I must tell you that for now, it only will recognize SIP calls. It will not recognize H323, MGCP, or SCCP. I have to admit, that is a little disappointing. However, that is really the only negative thing I can say about this tab. But, I suspect that will change in the future. But, keep in mind, you can still view H323, MGCP, and SCCP in the other tabs if you looking for them. Its just not in this tab. Overall, I’m still impressed with this VoIP capability. I’d really like to show you this screen, but there is just too much sensitive information I cant give out in my capture. So I’m only going to show you a piece of the screen, so that you get the idea of what you will see. I did blot out the personal info on this screenshot, but again, there is more to this screen than what I’m showing below.

There is a new “Ports” tab that shows all the ports being used on the network. From here, you can view the traffic conversations, along with the data flows. Again, this is really important in finding delays, etc. I really like this new addition to the Capsa product.
There is a “Matrix” tab which shows you in a circular diagram the traffic from source to destination. I dont use this much, except to get an impression on how many devices are actually talking to each other. From here, you can, again, look at the raw packets. I have heard other engineers say they like this view. I think this must be just personal preference.
The “Packet” tab takes you right to the raw packet view. Again, this is convenient, as you can go directly to search for specific IPs or MAC addresses quickly. And again, with all the info you would need in the display for finding what you want in the packet capture.
The “Log” view is just that. It shows you a log of successful and failed events. Anything from a global view of all traffic, to seeing only DNS, Email, HTTP, etc types of traffic. This is an excellent addition to the product when you need to see events outside a packet view.
The last tab is called “Report”. I absolutely love this tab. For the executives, you can run the reports they want to see without them actually being technical in nature. Lets face it, they just want the high level overview. They dont want to see the packet details, the troubles, etc. They just want the facts, and these canned reports will give them just that. Also, you can customize your own reports as well. You can even customize this to your company name, logo, etc. This is a nice feature.
Other features:
You can get Capsa to send you an audible alarm when an event happens, something you customize yourself. You can also get it to send you an email when the event happens, if you happen to not be in front of your Capsa PC/Server.
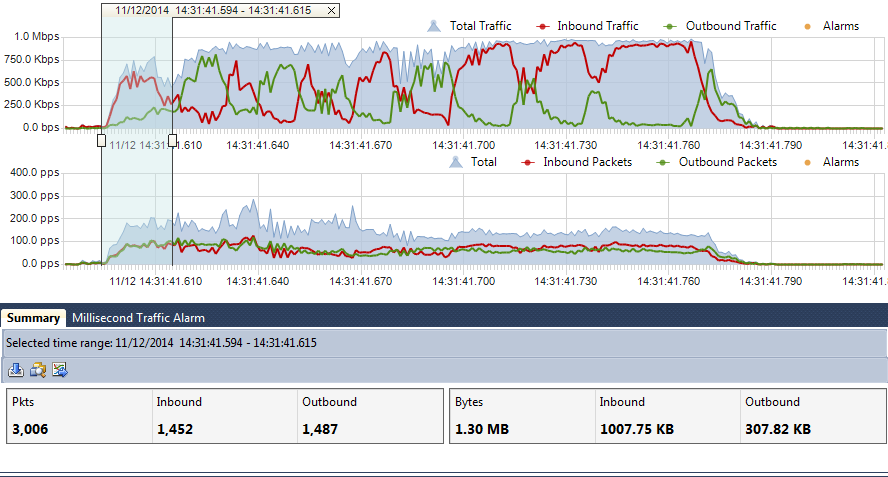
I also like the displays across the top of the program. I use the “utilization” and “pps” (packets per second) displays almost every time I use Capsa. These views are easy to detect broadcast storms, over utilization, etc. There is also a “Traffic Chart (bps)” chart that is a visual of the amount of traffic that is on the network. I like these views for sure. They are always up front and if something starts happening on the network, you can easily see some of these types of events in these displays. Very handy when you are going through the tabs and still able to see these views at the top. I personally like that this was carefully thought of for the network engineer.
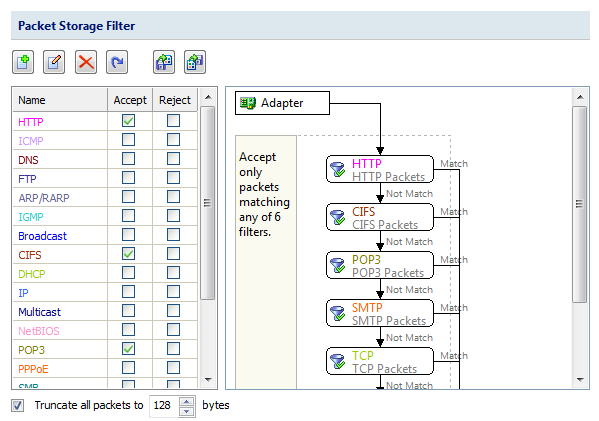
Another thing I like, is that if you are looking for only certain types of traffic, you can filter Capsa to only display that traffic without seeing all the other traffic you are not looking for. This is handy when you know where the problem is, but dont know the cause of the problem.
One thing to note here in this review. I have mentioned a lot of features in this program. However, what I have not mentioned is ALL of the capabilities in each tab. There are a ton of things you can do in most of the tabs. Don’t think I covered everything. I have only covered a fraction of what you get out of this product. What I suggest is that you go and download a demo of this product. Try it for yourself and download a trial of this to see if you like it. Visit Colasoft at www.colasoft.com, and let me know how you like it.
About Shane Killen
Shane Killen currently works at a consulting company in Birmingham, Alabama. It is a consulting firm that deals with most aspects of IT Technology.
He works as a IT consultant, serving as a Senior Network Engineer. Shane Killen has been working in IT professionally since 1996. Certifications currently hold – Cisco CCNP (R&S), Cisco CCNP Voice, Cisco CCDP, Brocade BCNP, ShoreTel Advance Systems and Troubleshooting, CompTIA Network+, CompTIA A+, CSSA, Palo Alto ACE.
From: http://www.shanekillen.com/2015/02/capsa-by-colasoft-product-review.html


