存档

‘Articles’ 分类的存档

NAT Packet Analysis Using Wireshark

2013年2月4日 1 条评论

by Tony Fortunato

Source: http://www.lovemytool.com/blog/2013/02/nat-packet-analysis-using-wireshark-by-tony-fortunato.html

One of the most popular questions I get when people get the hang of protocol analysis is the daunting exercise of multitrace analysis. As with anything else the best advice is to start with the basics before tackling anything complicated.

Multitrace analysis is only effective if you truly understand your vendors products, networking and how it relates to the OSI model or packet analysis. I always suggest that you start at layer 1 and work yourself up. The key is to know what fields in the frame or packet changes, or remains the same. Ideally when you figure this out you can use a better capture or display filter

A multitrace capture of a hub, switched, or bridged network is most straight forward since a hub or switch is transparent at layer 1 or 2 and doesn’t change anything in the packet.

When you move up to layer 3 or routing, several things change in the packet such as MAC address, IP TTL and TOS. Of course your mileage will vary, and any device could be configured to muck with more bits in the packet, but I figure I would give you a point of reference.

At layer 4 we get into application gateways, proxy, firewalls and NAT type devices where the following packet fields gets modified; MAC address, IP address, IP TOS, TCP/UDP port numbers, TCP ACK/SEQ values, etc.

Lastly at layer 7, we are dealing with multi-tiered applications and basically everything changes in the packet.

In this video example I do a multitrace analysis of a simple netgear router/NAT/firewall device where I take a trace from the WAN and LAN side to compare. Not to sound like a broken record, but please remember that your devices might behave totally differently and these notes and techniques should only be used as a reference  in your environment.

Check the video here:
http://www.youtube.com/embed/J9FzaFryQIw?feature=oembed

Configuring SPAN On Cisco Catalyst Switches – Monitor & Capture Network Traffic/Packets

2013年1月29日 没有评论

Source: http://www.firewall.cx/cisco-technical-knowledgebase/cisco-switches/940-cisco-switches-span-monitoring.html

Being able to monitor your network traffic is essential when it comes to troubleshooting problems, performing a security audit, or even casually checking your network for suspicious traffic.

Back in the old days, whenever there was a need to monitor or capture network traffic, a hub would be introduced somewhere in the network link and thanks to the hub’s inefficient design, it would copy all packets incoming from one port, out to all the rest of the ports, making it very easy to monitor network traffic. Those interested on hub fundamentals can read our Hubs & Repeaters article.

Of course switches work on an entirely different principle and do not replicate unicast packets out every port on the switch, but keep them isolated unless it’s a broadcast or multicast.

Thankfully, monitoring network traffic on Cisco Catalyst switches is a straight forward process, and does not require the presence of a hub. The Cisco method is called Switched Port Analyser also known as  SPAN.

Understanding SPAN Terminology

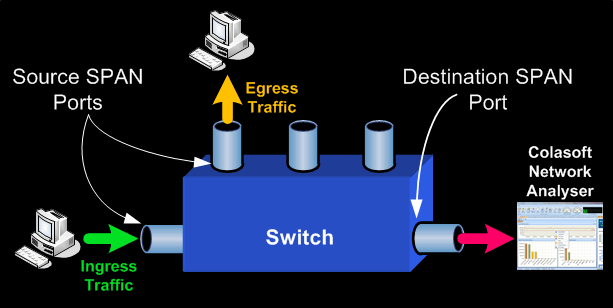
  • Ingress Traffic: Traffic that enters the switch
  • Egress Traffic: Traffic that leaves the switch
  • Source (SPAN) port: A port that is monitored
  • Source (SPAN) VLAN: A VLAN whose traffic is monitored
  • Destination (SPAN) port: A port that monitors source ports. This is usually where a network analyser is connected to.
  • Remote SPAN (RSPAN): When Source ports are not located on the same switch as the Destination port. RSPAN is an advanced feature that requires a special VLAN to carry the monitored traffic and is not supported by all switches. RSPAN explanation and configuration will be covered on another article.

cisco-switches-span-1

The network diagram above helps us understand the terminology and implementation of SPAN.

Source SPAN ports are monitored for received (RX), transmitted (TX) or bidirectional (both) traffic.  Traffic entering or exiting the Source SPAN ports are mirrored to the Destination SPAN port. Typically, you would connect a PC with a network analyser (we trust and use Colasoft’s Capsa Enterprise) on the Destination SPAN port, and configure it to capture and analyse the traffic.

The amount of information you can obtain from a SPAN session really depends on how well the captured data can be interpreted and understood.  Tools such as Capsa Enterprise will not only show the captured packets, but automatically diagnose problems such as TCP retransmissions, DNS failures, slow TCP responses, ICMP redirect messages and much more. These capabilities help any engineer quickly locate network problems which otherwise could not be easily found.

Basic Characteristics and Limitations of Source Port

A source port has the following characteristics:

  • It can be any port type, such as EtherChannel, Fast Ethernet, Gigabit Ethernet, and so forth.
  • It can be monitored in multiple SPAN sessions.
  • It cannot be a destination port (that’s where the packet analyser connects to)
  • Each source port can be configured with a direction (ingress, egress, or both) to monitor. For EtherChannel sources, the monitored direction applies to all physical ports in the group.
  • Source ports can be in the same or different VLANs.
  • For VLAN SPAN sources, all active ports in the source VLAN are included as source ports.

Basic Characteristics and Limitations of Destination Port

Each SPAN session must have a destination port that receives a copy of the traffic from the source ports and VLANs.

A destination port has these characteristics:

  • A destination port must reside on the same switch as the source port (for a local SPAN session).
  • A destination port can be any Ethernet physical port.
  • A destination port can participate in only one SPAN session at a time.
  • A destination port in one SPAN session cannot be a destination port for a second SPAN session.
  • A destination port cannot be a source port.
  • A destination port cannot be an EtherChannel group.

Limitations of SPAN on Cisco Catalyst Models

Following are the limitations of SPAN on various Cisco Catalyst switches:

  • Cisco Catalyst 2950 switches are able only to have one SPAN session active at a time and can monitor source ports. These switches cannot monitor VLAN source.
  • Cisco Catalyst switches can forward traffic on a destination SPAN port in Cisco IOS 12.1(13)EA1 and later
  • Cisco Catalyst 3550, 3560 and 3750 switches can support up to two SPAN sessions at a time and can monitor source ports as well as VLANs
  • The Catalyst 2970, 3560, and 3750 Switches do not require the configuration of a reflector port when you configure an RSPAN session.
  • The Catalyst 3750 Switches support session configuration with the use of source and destination ports that reside on any of the switch stack members.
  • Only one destination port is allowed per SPAN session, and the same port cannot be a destination port for multiple SPAN sessions. Therefore, you cannot have two SPAN sessions that use the same destination port.


Configuring SPAN On Cisco Catalyst Switches

Our test-bed was a Cisco Catalyst 3550 Layer 3 switch, however the commands used are fully supported on all Cisco Catalyst 2940, 2950, 2955, 2960, 2970, 3550, 3560, 3560−E, 3750, 3750−E and 4507R Series Switches.

The diagram below represents a typical network setup where there is a need to monitor traffic entering (Ingress) and exiting (Egress) the port to which the router connects to (FE0/1). This strategically selected port essentially monitors all traffic entering and exiting our network.

cisco-switches-span-2

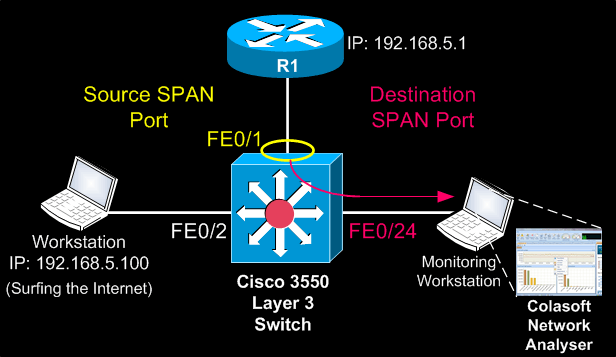
Since router R1 connects to the 3550 Catalyst switch on port FE0/1, this port is configured as the Source SPAN port.  Traffic copied from FE0/1 is to be mirrored out FE0/24 where our monitoring workstation is waiting to capture the traffic.

Because serious network procedures require serious tools, we opted to work with Colasoft’s Capsa Enterprise edition, our favourite network analyser. With Caspa Enterprise, we were able to capture all packets at full network speed and easily identify TCP sessions and data flows we were interested in. If you haven’t tried Capsa Enterprise yet, we would highly recommend you do by visiting Colasoft’s website and downloading a copy.

Once we got our network analyser setup and running, the first step is to configure FastEthernet 0/1 as a source SPAN port:

Catalyst-3550(config)# monitor session 1 source interface fastethernet 0/1

Next, configure FastEthernet 0/24 as the destination SPAN port:

Catalyst-3550(config)# monitor session 1 destination interface fastethernet 0/24

After entering both commands, we noticed our destination’s SPAN port LED (FE0/24) begun flashing in synchronisation with that ofFE0/1’s LED – an expected behaviour considering all FE0/1 packets were being copied to FE0/24.

Confirming the monitoring session and operation requires one simple command, show monitor session 1:

Catalyst-3550#  show monitor session 1

Session 1

———

Type                  : Local Session

Source Ports      :

Both              : Fa0/1

Destination Ports: Fa0/24

Encapsulation : Native

Ingress: Disabled

To display the detailed information from a saved version of the monitor configuration for a specific session, issue the show monitor session 1 detailcommand:

Catalyst-3550# show monitor session 1 detail

Session 1

———

Type              : Local Session

Source Ports      :

RX Only         : None

TX Only         : None

Both              : Fa0/1

Source VLANs    :

RX Only       : None

TX Only       : None

Both            : None

Source RSPAN VLAN : None

Destination Ports      : Fa0/24

Encapsulation       : Native

Ingress:         Disabled

Reflector Port           : None

Filter VLANs              : None

Dest RSPAN VLAN    : None

Notice how the Source Ports section shows Fa0/1 for the row named Both . This means that we are monitoring both RX & TX packets for Fa0/1, while the Destination Port is set to Fa0/24.

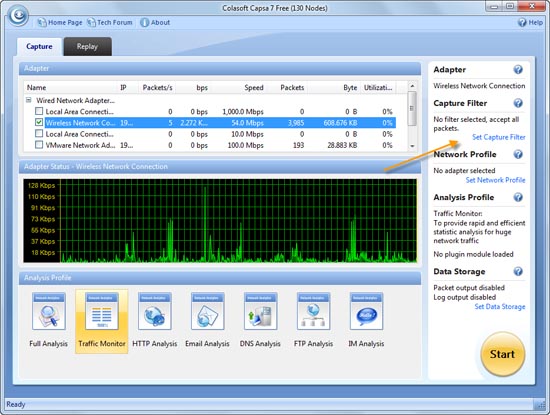
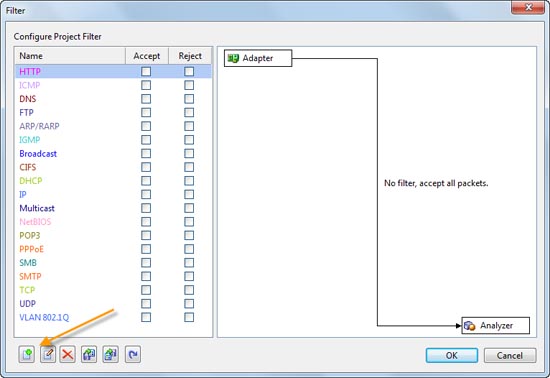
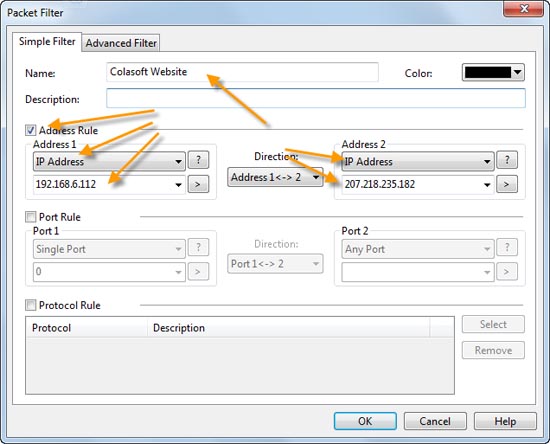
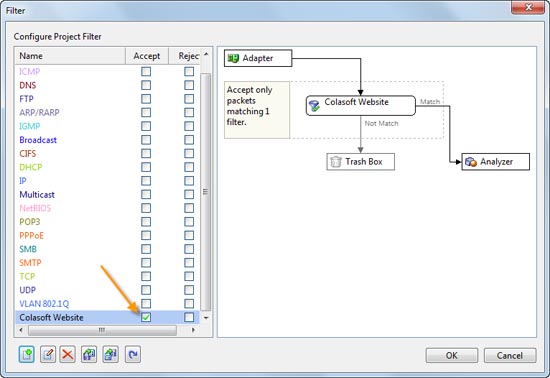
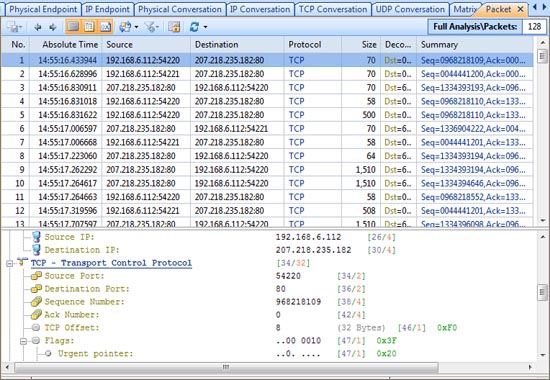
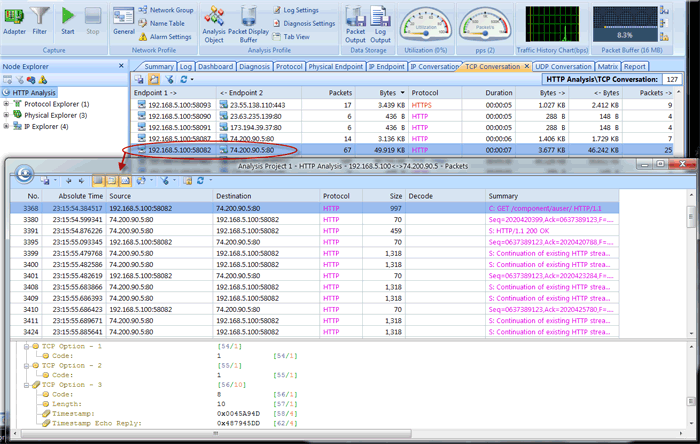
Turning to our Capsa Enterprise network analyser, thanks to its predefined filters, we were able to catch packets to and from the worksation monitored:

cisco-switches-span-3

This completes our discussion on SPAN configuration and how to monitor/capture packets on a Cisco Catalyst switch.  Upcoming articles will cover RSPAN and more advanced packet capturing techniques using dedicated VLANs for captured traffic and other complex scenarios.


分类: Articles 标签: , , ,

Use Filters to Capture Packets between Two Hosts

2012年11月11日 2 条评论

Product Versions: Since Capsa 7.0

Intended Audience:

  • Capsa Enterprise users
  • Capsa Professional users
  • Capsa WiFi users
  • Capsa Free users
  • Including all Demo and Evaluation users

When we need to do some tests or experiments, we just need to capture packet data between two hosts. The typical instance is to capture packet data between my local host and another host/server. In order to capture packets only between two hosts we can use a capture filter to ignore all packet data that we don’t need. For instance, we want to capture packets only between my host and Colasoft website:

  • My IP address – 192.168.6.112
  • Colasoft Website IP address – 207.218.235.182

Before we get started we should figure out where is the best place to capture packet data, make sure you are capturing right on the path of the traffic flow, read Where to Capture Packets on my Network for more details. If you are planning to capture packet data between your local host and another machine, the convenient way to do so is to install Capsa on your machine. And follow the steps below to create and enable a capture filter.

Create a Capture Filter in Capsa

  • Run Capsa; click the Set Capture Filter link on top-right corner.
  • Capsa Start Page

  • Capture filter window appears. Click the Add button (on the bottom on the window).
  • Filter Manager

  • Input Name, check Address Rule, and choose IP Address from Address 1 drop-down list. Input IP address, 192.168.6.112, in the textbox under the drop-down list. Then choose IP Address from Address 2 drop-down list, and input IP address – 207.218.235.182.
  • Filter

  • Click OK.
  • Check the new filter’s Accept checkbox, and click OK.
  • Enable Filter

We’ve already created and enabled Capsa to capture packet data only between my host and the remote IP address. Next we can click Start button to start a capture. And we see only packets between my local IP and Colasoft website address. By this way we can create filters to capture packets for certain IP or MAC addresses and also use combinations to create advanced filters with multiple conditions.

Packets

Tips:

  • You are suggested to use the Export function to back up your filter settings (you can find the Export button on Figure A), and make sure you export all filters.

分类: Articles, Tips & How-tos 标签:

Video Tutorials for nChronos

2012年9月13日 1 条评论

About nChronos

nChronos is a back-in-time network analysis server for high performance & critical enterprise networks. It combines nChronos Console and nChronos Server to deliver the capability of 7*24 continuous packet capturing, unlimited data storage, efficient data mining and in depth traffic analysis.

nChronos Console provide quick access to all distributedly deployed nChronos Servers where packets are stored, it serves as the center of the enterprise network management which is capable of visualizing the overall enterprise network activities, drilling down to isolate performance issues and troubleshooting high-priority and critical network issues.

nChronos Server performs 7*24 real-time packet capturing and continually store to hard disk for quick packets and statistics retrieval. With flexible and non-intrusive deployment with standard network mirror port or link tap technologies, it provides native packets for the Console to go back in time and complete retrospective network analysis.

With nChronos, you can

  • Retrospectively analyze the historical network traffic;
  • Proactive network monitoring and cost-effective network management;
  • Efficient drill-down for data-mining & index;
  • Provide forensics analysis and mitigate security risks;
  • Remote access for distributed LAN/WAN network management.

Video Tutorials List

分类: Articles 标签:

How to Create and Edit Custom Protocol

2012年5月20日 没有评论

Although Capsa network analyzer supports more than 160 protocols, there are still circumstances that you need add your private protocol rules. For example, you have a special service using a private TCP port in the network, and you want Capsa to recognize it. Or a protocol uses non-standard port. This document is to show you how to create your own custom protocols and edit built-in protocols as your need.
Create Custom Protocols
If you want to create a private protocol rule, follow the instructions below.
Step 1, run Capsa network analyzer. On the Start Page, click the Menu button (on the top-left corner). Choose Local Engine Settings -> Custom Protocol from the menu.
Step 2, on the Custom Protocol window, you can click the Add… button to create a custom protocol. For example, you are testing a new protocol, which uses TCP port 8080. You can just click Add, and type in protocol name, short name and port number, and choose a color for the protocol on the new dialog box. Then click OK to save the custom protocol.

Note: if the capture is running, you need to go back to the start page. Otherwise the Add button and Edit button will be grayed out.
Edit Protocols
If you use non-standard protocols in your network, for example, DNS isn’t on port 53 (TCP or UDP), or HTTP isn’t on TCP port 80, you should modify the default port number for these two built-in protocols. Or Capsa will recognize them as TCP/UDP Other type. Let’s make an example that HTTP uses TCP port 8080, rather than port 80.
Step 1, open the Custom Protocol window, type in http in the search box.
Step 2, double-click on the HTTP protocol item, and modify its port number to 8080 in the dialog box. Click OK to save.

Now if you start a capture, or replay a packet file, all packets using TCP port 81 will be labeled as HTTP protocol. On the Custom Protocol window, you can create private protocols on TCP/UDP ports, IP protocol type, and Ethernet type. TCP and UDP port numbers are used more often rather than the other two. And also you can use the Import button and Export button to back up your private protocols.

FAQ: Why the Add/Edit/Delete buttons of the Custom Protocol window are grayed out?
You are not allowed to change protocol rules while there is a capture running because the changes could crash the program. If you need to add/edit protocol rules, you need stop the capture and go back to the Start Page (if you run multiple instances, you need to close all others). Then click on the Menu button on the top-left corner of the Start Page, and choose Local Engine Settings > Custom Protocol to open the Custom Protocol window. Now you will find the buttons are clickable.

How to baseline network throughput and performance

2012年5月10日 1 条评论

What is network baseline?

Do you know what your normal network throughput volume is, what types of traffic are most used in your network? If you can’t answer these questions then you should baseline your network. Network baseline is very important to network management because the data will tell you what it’s like when everything goes all right.

To baseline your network, you need software or hardware to listen on your network or a particular device. Both Colasoft nChronos and Capsa can be used to accomplish this task. Both of them are used to listen into packet data of a wire and generate all kinds of statistics on the network. To baseline a network, you need to use them to monitor the network traffic long enough, because a wider time span presents a more real picture of network traffic pattern. The use of network baseline is listed as follows:

• Understand healthy network pattern and traffic trends.

• Evaluate network management policies compliance.

• Understand how the network resources are allocated.

• Accelerate to troubleshoot network issues, i.e. abnormal traffic and spam traffic, etc.

• Provide data on network and security management to support decision making.

• Provide history statistics on network upgrade.
阅读全文…

Colasoft Thanksgiving Big Sale is On The Way!

2011年11月15日 没有评论

As the big holiday Thanksgiving is coming very soon, Colasoft are wishing all of our customers and software users a great Thanksgiving! It’s time to sharing and spreading happiness, to celebrate this great holiday, we are preparing a big sale to offer you the most cost-effective software. It is coming very soon and up to 40% discount for both Capsa network analyzer and Colasoft nChronos will be available.

Free trail of Capsa network analyzer and nChronos is available for download at our website www.colasoft.com.

How to Display IP Address As Host Name

2011年11月2日 1 条评论

In business network settings, network administrators manage a large number of devices, like laptops, desktops, printers, switches and routers and they all have IP and MAC addresses. When we use a network analyzer to monitor the network traffic on the network, we can see lots of IP and MAC addresses. These addresses, however, aren’t friendly to read so we’d like to show their host names or give them labels.

In Capsa we use Name Table to do this job for us. With name table we can not only label IP addresses but also MAC addresses and we can delete, export or reload the address items there. We can right-click on an IP address or MAC address and we see Add to name table in context menu.

On the dialog box we can give the IP (or MAC) address and alias, also we can choose a color for it. If we don’t know the host name, we can click Resolve address to automatically look up its host name. Then click OK to save the input.

Now back to Capsa and we can see the address is already replaced by the name alias we just created. The Add to name table function is applicable to any item on Node Explorer and all other views except Summary, Protocol and Report views.

If we need upgrade or reinstall Capsa, we can use Export function to back up the name items. Click Name Table icon on the ribbon, and click Export button to save the name table file. Then after installation or upgrade we can use the Import function to reload the name items back to the system.


Colasoft Enhances Capsa Network Analyzer with TCP Flow Analysis

2011年9月26日 没有评论

We are very excited to release the availability of Capsa Network Analyzer7.5. Except for the enhanced user interface, the biggest highlight of Capsa Network Analyzer7.5 is TCP flow analysis which makes it easier for network administrators to analyze application performance and pinpoint critical performance issues.

Capsa Network Analyzer 7.5 presents a comprehensive high-level overview of application health on your network. From TCP transaction analysis, you can easily access to more detailed information, including TCP server/client response time, delay, retransmissions, and further down to the server flow to observe the actual media content of the flow. “This unparalleled level of control and visibility speeds time to resolve application problems and minimize overall network downtime,” said Ocean Yu, Vice President at Colasoft.

In addition to MSN and Yahoo Messenger monitor, Capsa Network Analyzer 7.5 added ICQ monitor to meet the market demands. ICQ logs can be easily found at the log tab where detailed information is vividly displayed. Moreover, RADIUS protocol is supported as a new member in the more than 300 protocol analysis family.

Top Highlights of Capsa Network Analyzer 7.5:

1. Powerful TCP flow analysis for application performance optimization
2. Add ICQ monitor to analyze and log ICQ activities
3. Support RADIUS protocol analysis
4. Intuitive TCP transaction sequence diagram
5. Enhanced user interface & performance

Capsa 7.5 runs under Windows XP/2003/2008/Vista/7. A trial version is available for download.

How to monitor HTTP traffic with Capsa Free

2011年7月19日 1 条评论

It is one of the essential duties for network administrators to monitor their network traffic like HTTP traffic to see what applications are running on the network. There are countless network traffic monitor tools in the market which make us dazzling and hard to choose. Except for those costly network monitors, Capsa Free is a totally network freeware which serves much better than common network monitors in monitoring network traffic like HTTP traffic.

This article is mainly to guide you through the steps of how to monitor HTTP traffic with Capsa Free.

Capsa Free is a must-have freeware network analyzer for network monitoring, network troubleshooting and network analysis. It provides users with great experience to learn how to monitor network activities, pinpoint network problems,enhance network security and so on. Moreover, Capsa Free is a perfect choice for students, teachers and computer geeks to learn protocols and networking technology knowledge.

Step 1: Download and install Capsa Free.
Step 2: Initiate Capsa Free, choosing HTTP Analysis as the analysis profile.

Step 3: View the HTTP traffic statistics in different tabs of Capsa Free.

a. Summary view: overall statistics of the capture.
b. Log view: webpage visiting records (anyone visited a website, logged here).
c. Dashboard view: important statistic data showing in visualized charts.
d. Diagnosis view: auto detected network errors.
e. Protocol view: the applications/protocols running on the network, traffic statistics.
f. Physical Endpoint & IP Endpoint views: traffic volume statistics of each node (by MAC address or IP address).
g. IP Conversation, TCP Conversation & UDP Conversation views: statistics on two communication nodes (from layer 3 to layer 4).
h. Matrix view: map of how hosts are communicated (MAC or IP addresses).

For the different tabs view, please click here.

分类: Articles, Tips & How-tos 标签: